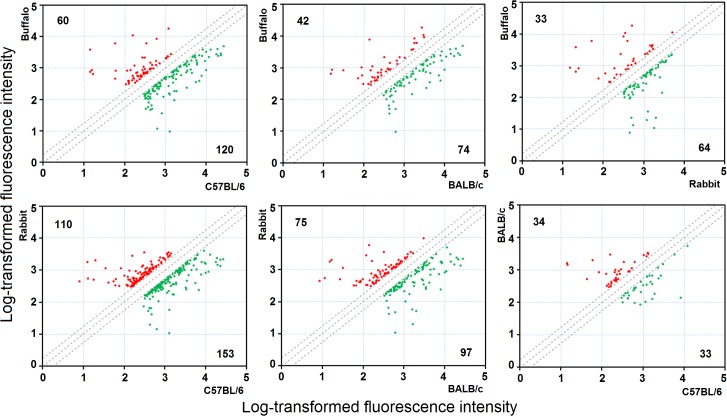
Fig 1. Scatter plots of pairwise comparisons between schistosomes from BALB/c mice, C57BL/6 mice, rabbits and water buffaloes.
The x-axis and y-axis correspond to the log-transformed fluorescent intensity values of genes in the pairwise worm samples. The red plots and green plots represent up-regulated genes and down-regulated genes, respectively (FC≥2, p<0.05). The number of up-regulated genes or down-regulated genes is shown at the upper left and lower right, respectively.

