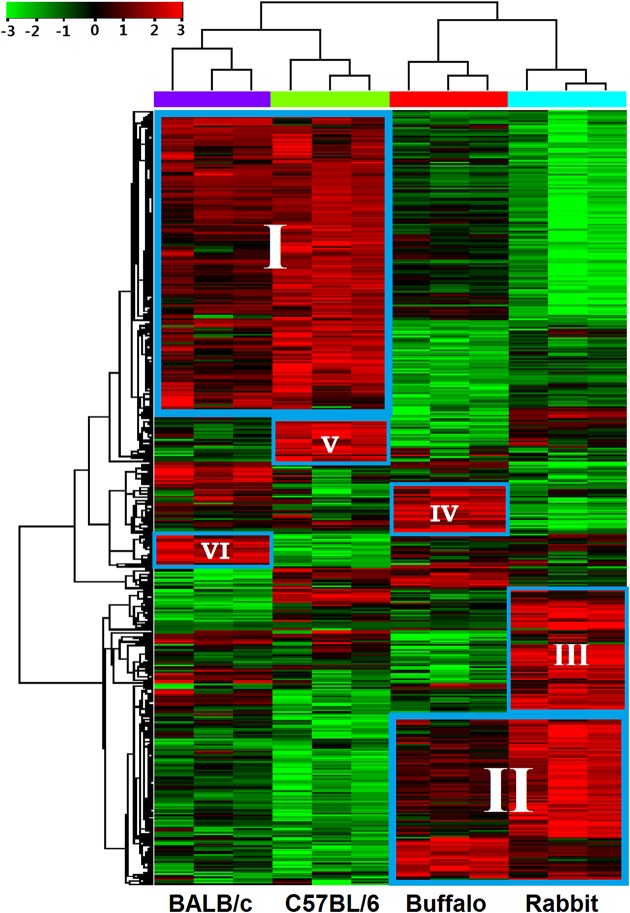
Fig 2. Hierarchical clustering of differentially expressed genes in worms from BALB/c mice, C57BL/6 mice, rabbits and water buffaloes.
The heat map of 450 differentially expressed genes extracted from the microarray dataset is shown (three biological replicates were performed for each worm sample). Six major clusters of differentially expressed genes were identified: cluster I, genes significantly expressed in worms from BALB/c mice and C57BL/6 mice; cluster II, genes highly expressed in worms from water buffaloes and rabbits; cluster III-VI, genes respectively up-regulated in the worms from rabbits, water buffaloes, C57BL/6 mice and BALB/c mice. The color scale represents relative expression levels: red, up-regulated; green, down-regulated; and black, unchanged.

