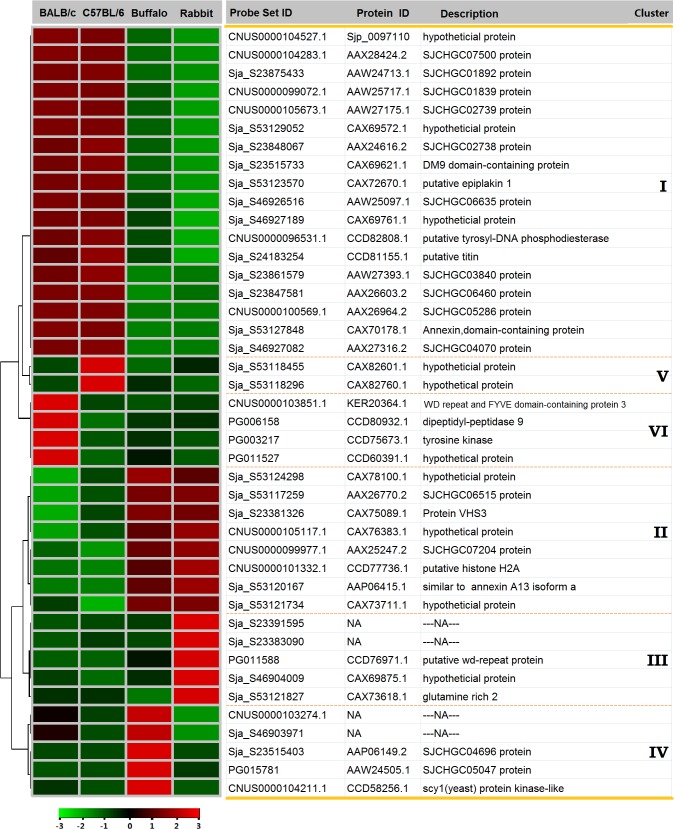
Fig 3. Examples of differentially expressed genes from the six clusters.
The heat map illustrates the hierarchical clustering of 42 selected common differentially expressed genes using the average gene expression values of the three biological replicates. The color scale represents relative expression levels: red, up-regulated; green, down-regulated; and black, unchanged.

