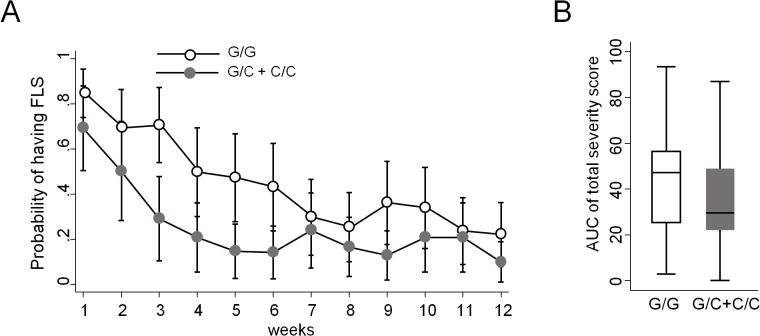
Fig 2. FLS probability and severity.
(A) Probability to develop FLS calculated during the follow-up of 12 weeks in patients bearing at least one allele with a C at position -174 of IL-6 gene and in those bearing only the allele with the G at the same position. (B) Area under the curve (AUC), calculated as the total symptoms scores that were self-reported after each injection in patients bearing at least one allele with a C at position -174 of IL-6 gene and in those bearing only the G allele at the same position.

