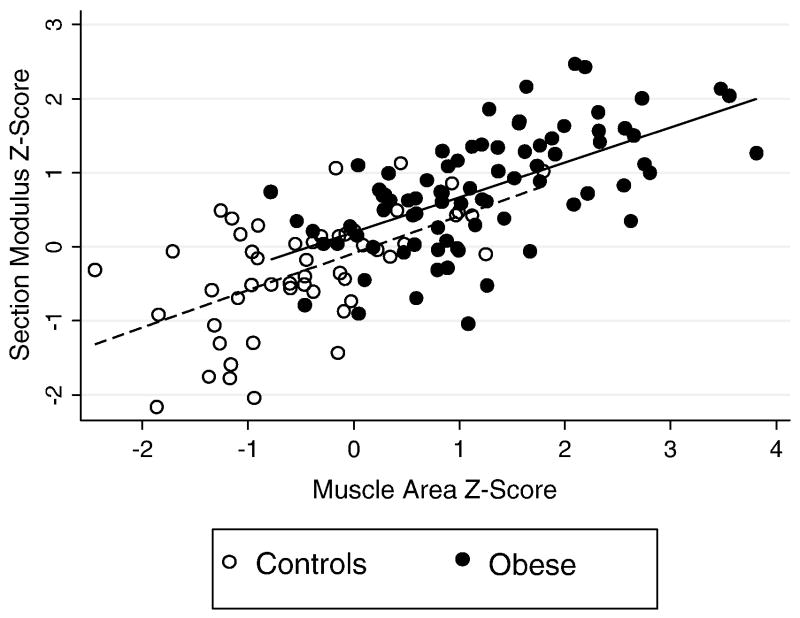
Fig. 1.
Tibia cortical section modulus Z-score relative to muscle area Z-score in obese and non-obese control participants. This figure illustrates the markedly greater muscle area and section modulus Z-scores in the obese participants, and the positive association observed in both groups. Section modulus Z-score relative to muscle area Z-score was marginally greater in obese compared with non-obese participants (p = 0.06).

