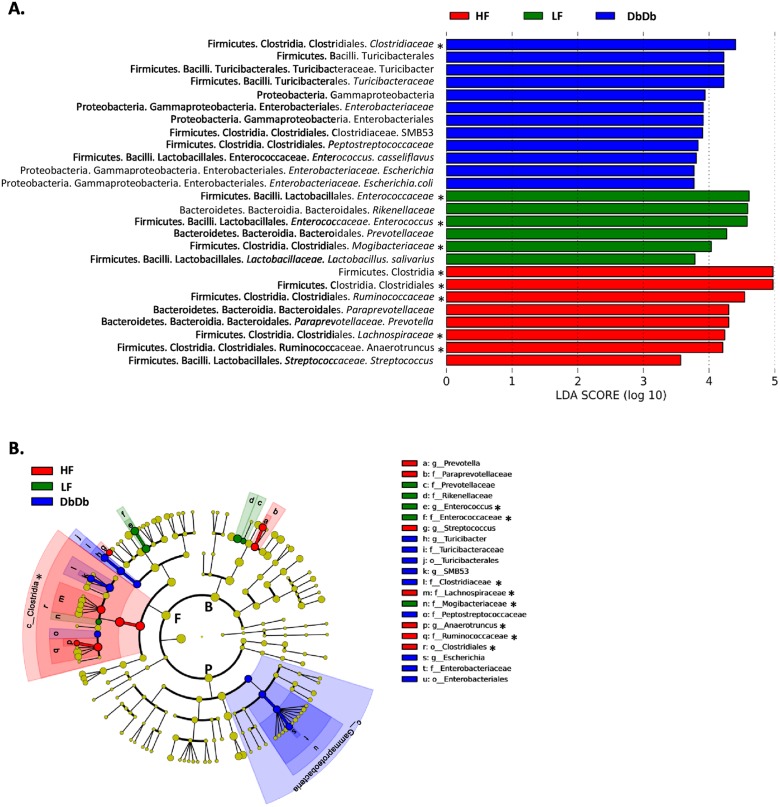
Fig 2. LDA effect size analysis of between group differences in stool bacterial abundances in Apc1638N mice.
A) Output showing effect size of 29 significantly enriched taxa in each group. Model = group x gender. B) Significant taxa plotted onto a cladogram. F, Firmicutes; P, Proteobacteria; B, Bacteroidetes; c_, class; o_, order; f_, family; g_genus, s_, species. * taxa that were also associated with that group in the MaASLin analysis. N = 29.

