
FIGURE 5.
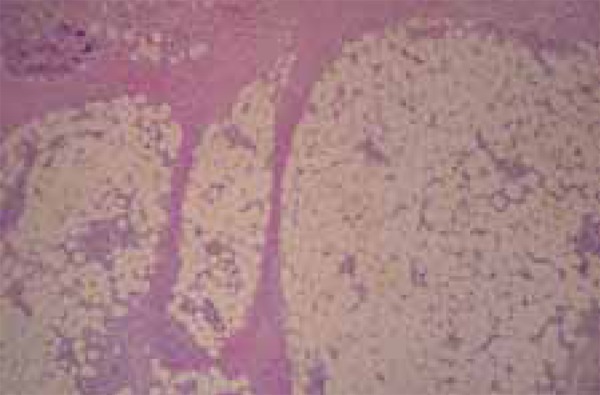
H and E, 10x: shows inflammatory infiltrate around blood vessels in subcutaneous fat
Official websites use .gov
A
.gov website belongs to an official
government organization in the United States.
Secure .gov websites use HTTPS
A lock (
) or https:// means you've safely
connected to the .gov website. Share sensitive
information only on official, secure websites.
H and E, 10x: shows inflammatory infiltrate around blood vessels in subcutaneous fat