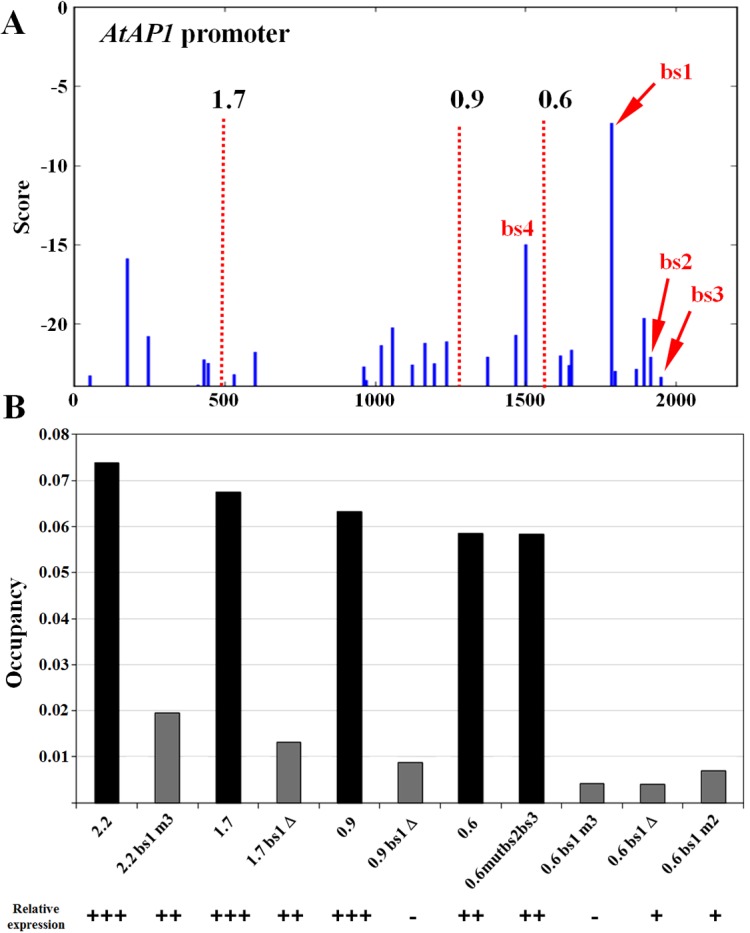
Fig 3. Comparison of LEAFY binding analysis in A. thaliana AP1 promoter using the Morpheus suite with in vivo promoter expression study [39].

A) Score profile graphic output of the Morpheus ‘Score’ tool (option limit = -25) using 2.2 kb upstream of AP1 start codon. Red dotted lines show the different promoter sizes and arrows mark the mutated BS, accordingly with promoters set described in [39]. B) Predicted occupancy (option All) shows a good correspondence with relative expression of each promoter version as determined experimentally in a published study and summarized: expression levels: +++ (high), ++ (medium), + (low),—(not detectable). The number indicates the size of the promoter (2.2, 1.7, 0.9 or 0.6 kb), m2 and m3 indicate mutations in bs2 and bs3 respectively, ∆1 indicates a deletion of bs1. In vivo, mutations of bs2 and bs3 (promoter 0.6 mutbs2bs3) has only a weak effect while elimination of bs1 drastically affects AP1 expression.
