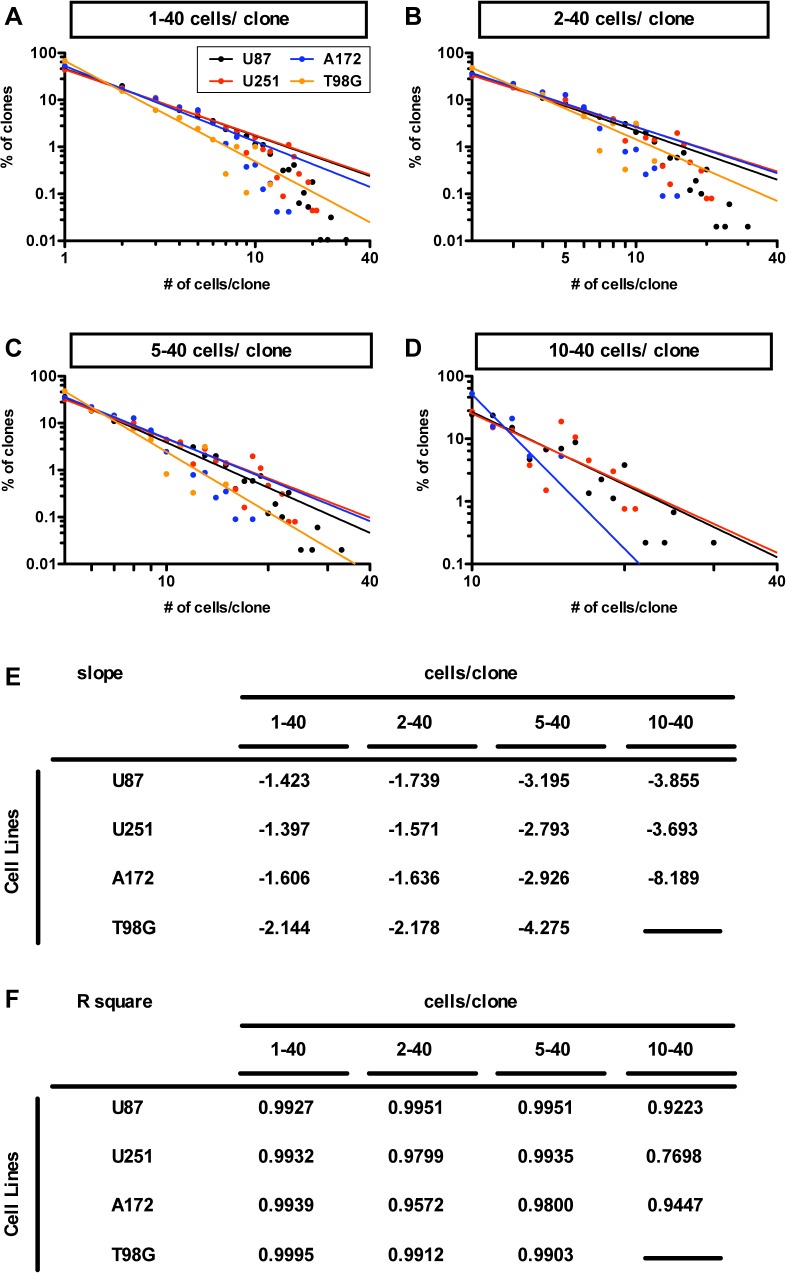
Fig 2. Power-law in frequency distribution of glioma cell line-derived GSs in the tumor neurosphere culture.
(A)–(D) Power-law for growth in the population of U87 (circles and the regression line in black); U251 (in red); A172 (in blue); T98G (in orange) derived GS clones. The graphs show the double logarithmic plot of the size and the frequency of the GS clones at day 7 for the population of all clones (1–40 cells/clone for A), of self-renewed clones (2–40 cells/clone for B), of clones with five to forty cells (5–40 cells/clone for C) and of clones with ten to forty cells (10–40 cells/clone for D). (E)-(F) The tables show slopes (E) and R values squared (F) of the regression lines of (A)-(D).

