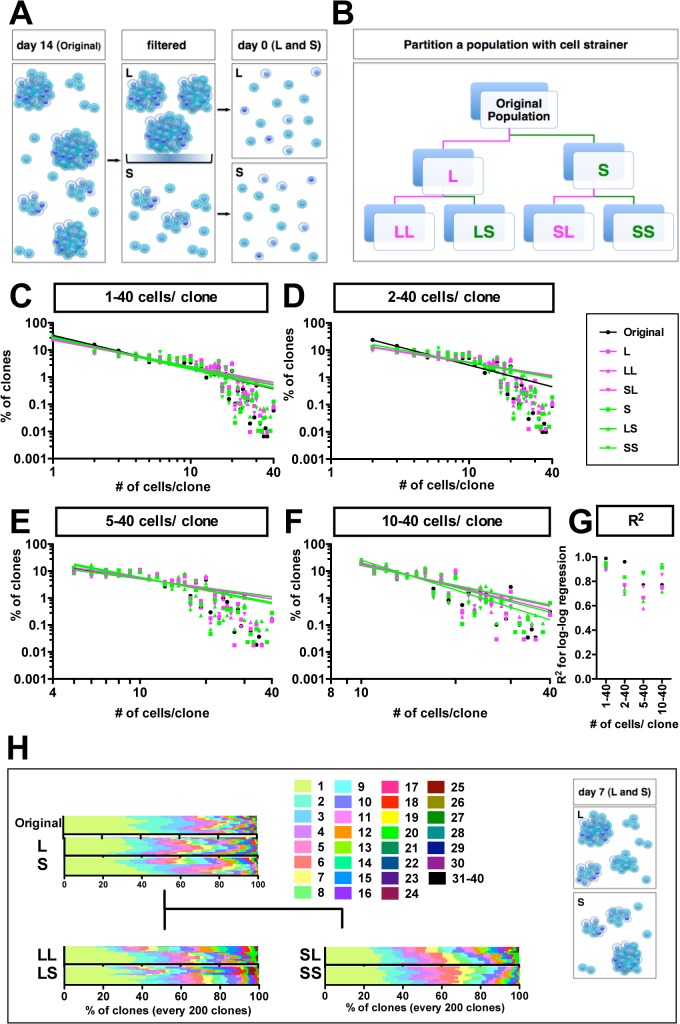
Fig 4. Recapitulation of power-law growth during repopulation of both large- and small-sized clones.
(A) Schematic diagram of separation of clones by filtration. The population of clones developed for 14 days were filtered with a 40 μm cell strainer. Clones in both large retained (L fraction) and small passed (S fraction) were dissociated into single cells with trypsin. The cells were then clonally seeded in the methylcellulose matrix. (B) The strategy for how the original population was partitioned. The original population of clones was partitioned into L and S fractions. Clones derived from both L and S fractions were developed for 14 days and partitioned into LL and LS sub-fractions from the L fraction, and into SL and SS sub-fractions from the S fraction. (C) The graph shows a double logarithmic plot of the clone size (number of cells in each clone) and the frequency of the GS clones at day 7 for each separate population (C-F); of all clones (C); of self-renewed clones (D); of clones with five to forty cells (E); of clones with ten to forty cells (F). Sines in (C-F) are regression lines for the double logarithm plots. The R2 values for the log-log regression lines in (C) are 0.99, 0.92, 0.90, 0.89, 0.95, 0.92 and 0.92 for the original, L, LL, SL, S, LS and SS fractions shown in (G). (H) Bar graphs in each experiment show the composition of every two hundred diverse clones at day 7. The number of quantified clones in each separate experiment ranged from 2098 to 10392 clones. Colored patterns, which indicate the number of cells per clone, are listed. A summary diagram is shown.

