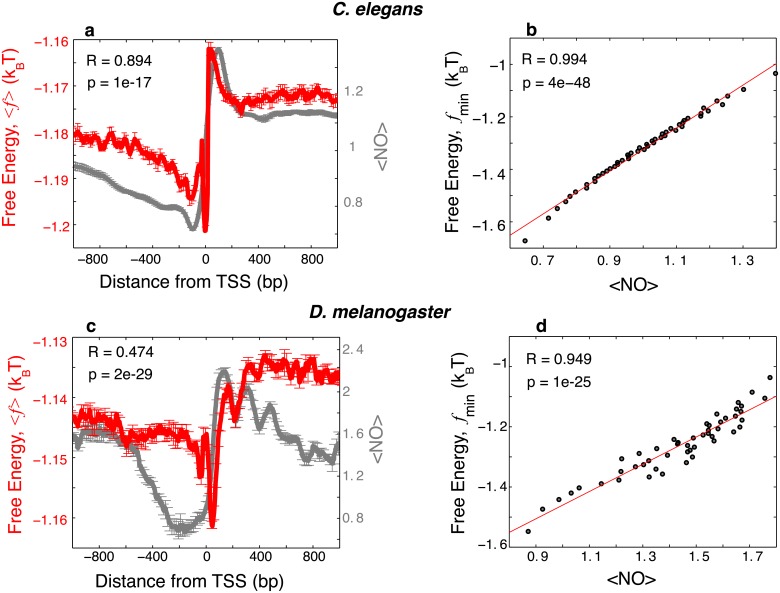
Fig 3. The free energy of nonconsensus TF-DNA binding positively correlates with the nucleosome occupancy.
(a) The average free energy of nonconsensus TF-DNA binding per bp, (red), and the average nucleosome occupancy from [4] (gray), around the TSSs of 23,287 mRNA coding and non-coding C. elegans genes. The linear correlation coefficient is computed for a linear fit of 〈f〉 versus the average nucleosome occupancy at individual genomic locations, computed every 4 bp, within the interval (-1000,1000). In order to compute error bars, we divided genes into five randomly chosen subgroups, and computed 〈f〉 for each subgroup. The error bars are defined as one standard deviation of 〈f〉 between the subgroups. (b) Correlation between the minimal value of the free energy of nonconsensus TF-DNA binding, f min = min(f), and the nucleosome occupancy, computed for individual genes in non-overlapping windows of 100 bp within the interval (-1000,1000) around the TSS for each of the 23,287 genes. The data was grouped into 50 bins. (c) Similar to (a) but showing the average free energy of nonconsensus TF-DNA binding per bp, 〈f〉 (red), and the average H2A.Z nucleosome occupancy (grey) around the TSSs of 12,188 D. melanogaster genes [32]. (d) Similar to (b) but for 12,188 D. melanogaster genes.

