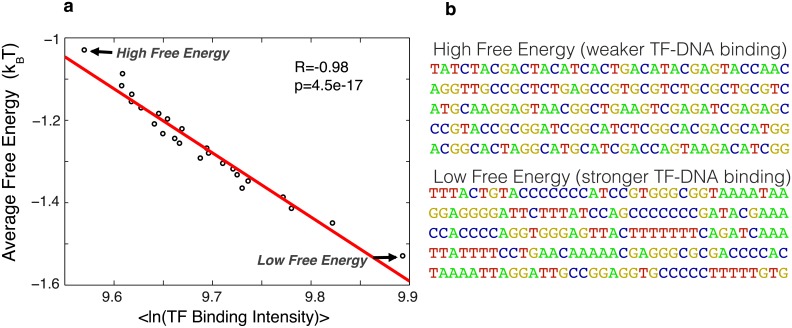
Fig 4. Random-binder model for nonconsensus protein-DNA binding provides a good statistical description of the TF-DNA binding strength measured in vitro.
(a) Plots show the correlation between the free energy of nonconsensus TF-DNA binding, 〈f〉, and the measured average TF binding intensity of 82 mouse TFs [34]. We used the data from the PBM experiments performed on universal arrays, which provide measurements of TF binding to all possible 8-bp sequences (8-mers). The data for average TF intensity and free energy was grouped into 25 bins. (b) Typical examples of sequences with high and low values of the nonconsensus free energy, respectively, as determined by the in vitro PBM measurements.

