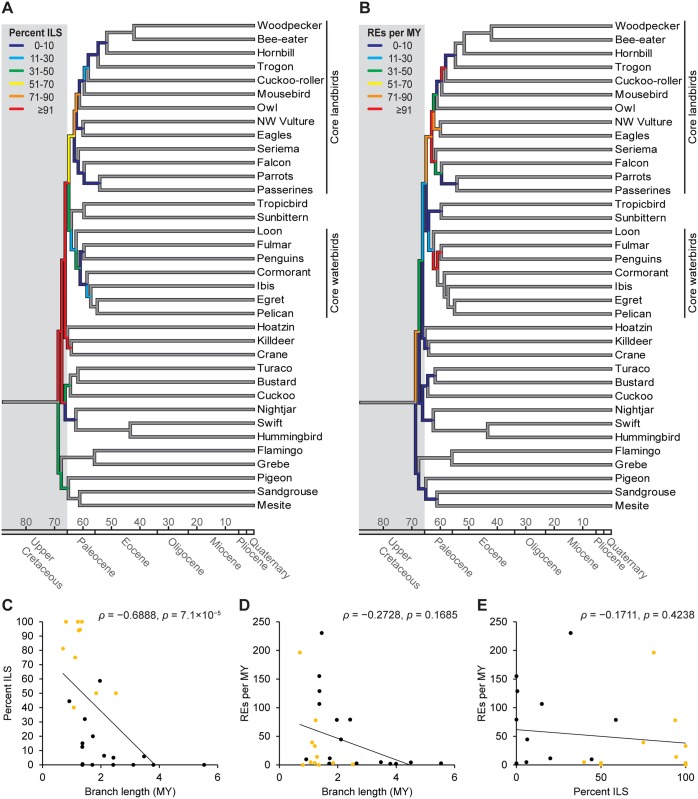
Fig 3. Dynamics of incomplete lineage sorting and RE insertion rates across the dated main Jarvis et al. tree [4].
Per-branch levels of ILS (A) and RE insertion rates (B) vary considerably across the diversification of Neoaves. We derived these values from mapping our 2,118 RE markers on the main Jarvis et al. tree [4] (Fig 1A). For each branch, percentages of ILS were calculated by dividing the amount of ILS-affected markers by the total amount of markers (S2 Table). The latter value was then divided by the respective branch length to estimate the RE insertion rate per MY (S2 Table). Notably, branch length and degree of ILS correlate negatively (S2 Table) (C), but there is no correlation between branch length and RE insertion rate (S2 Table) (D) or between degree of ILS and RE insertion rate (S2 Table) (E). Orange dots denote those branches that are incongruent between the main Jarvis et al. tree [4] and our MPRE tree (cf. Fig 1A and 1B).

