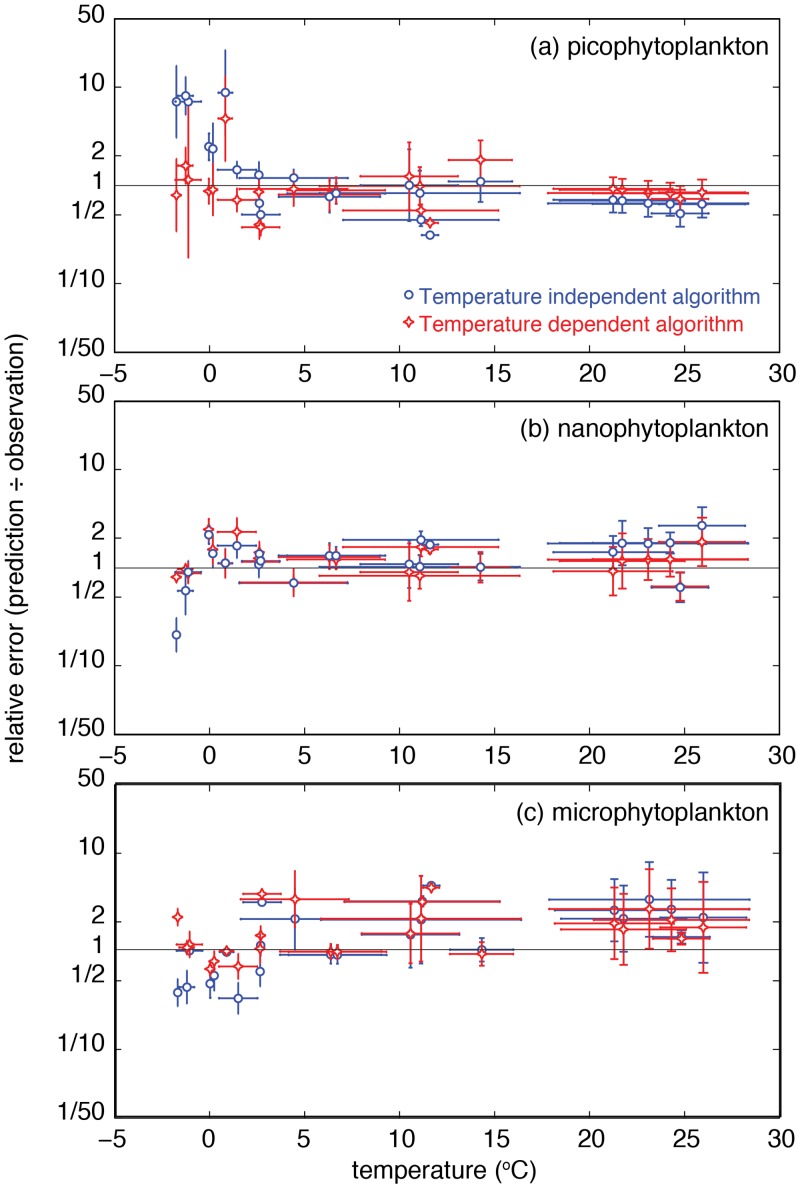
Fig 3. Relative error of the temperature-dependent and temperature-independent functions when used to predict size-class biomasses for independent, unassimilated observations.
Dots represent the mean temperature and geometric mean relative error for each data subset, with error bars showing ±1 standard deviation for temperature, and 1 geometric standard deviation for the relative error.

