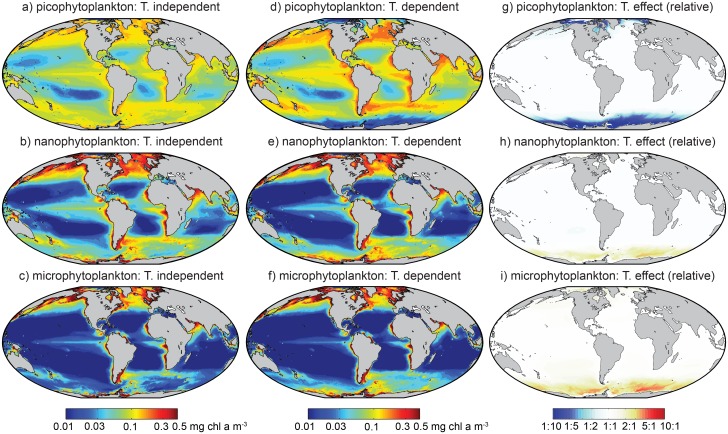
Fig 4. Satellite-derived estimates of annual mean surface chlorophyll a biomass in three phytoplankton size classes.
Panels (a-c): Temperature-independent functions (Eq 1). Panels (d-f): Temperature-dependent functions (Eq 2). Panels (g-i): Relative change in biomass attributable to temperature, calculated by removing the two chlorophyll-dependent terms from Eq 2.

