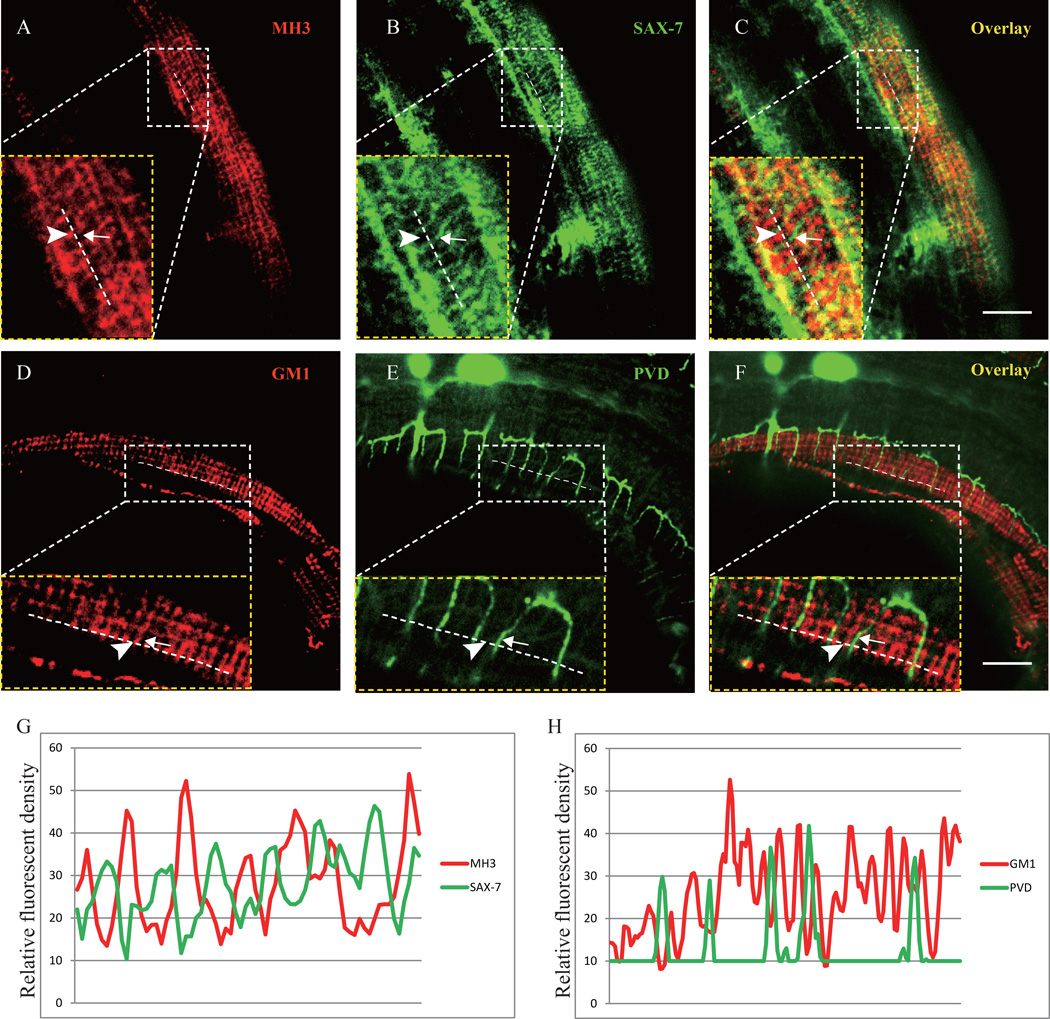
Fig. 3. UNC-52 and SAX-7 exhibit interdigitated localization pattern.
A–C) Confocal images of SAX-7::GFP transgenic animal double stained with the MH3 (UNC-52) and GFP antibodies. The images of the inset are zooming in views of the region indicated by the box. Arrow points to the SAX-7 stripe and arrowhead marks the UNC-52 staining. D–F) Confocal images of a PVD::GFP animal strained with the GM1 (UNC-52) antibody. The images of the inset are zooming in views of the region indicated by the box. Arrows indicate the PVD 4° branch and arrowheads mark the UNC-52 staining. G) Line profiles of fluorescence intensity of UNC-52 and SAX-7. H) Line profiles of fluorescence intensity of UNC-52 and PVD::GFP. A clear staining region was chosen randomly to zoom in and the schematic dotted line was drawn along the longitudinal UNC-52 puncta using ImageJ. The relative fluorescence intensity along the dotted lines in two channels (GFP and mCherry) was plotted to form the picture. Scale bar is 10 µm.

