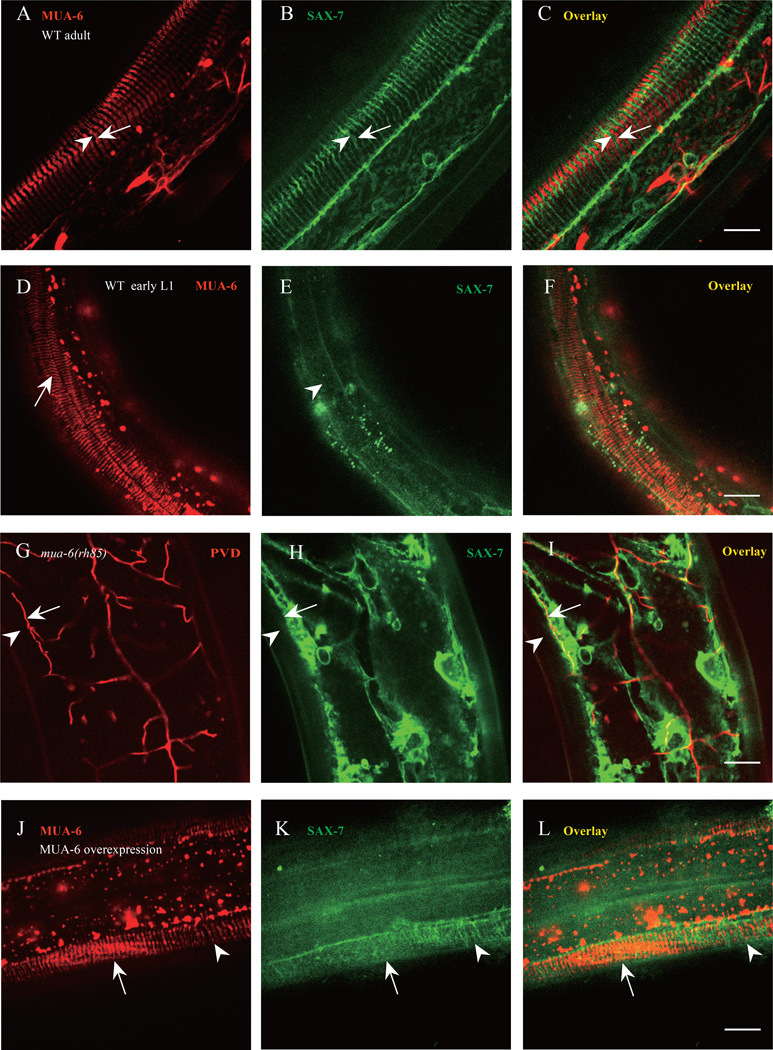
Fig. 6. Hypodermal FOs pattern SAX-7 stripes and then PVD 4° branches.
A–C) Confocal images of the MUA-6::mCherry and SAX-7::GFP. Arrow indicates one FO stripe and arrowhead shows one SAX-7 stripe. n=30. D–F) Confocal images of the MUA-6::mCherry and SAX-7::GFP in a newly hatched L1 worm. Arrow indicates one FO stripe and arrowhead shows the region which SAX-7 stripe will form. n=20. G–I) Confocal images of the SAX-7::GFP and PVD::mCherry in mua-6(rh58) mutant. Arrows indicate PVD tertiary dendrite and arrowhead shows the region where SAX-7 stripe and PVD 4° branch should be. n=20. J–L) Confocal images of overexpressed MUA-6::mCherry and SAX-7::GFP. Arrow indicates the region where MUA-6 is overexpressed and arrowhead shows the normal MUA-6 expression region. n=10. Scale bar is 10 µm.

