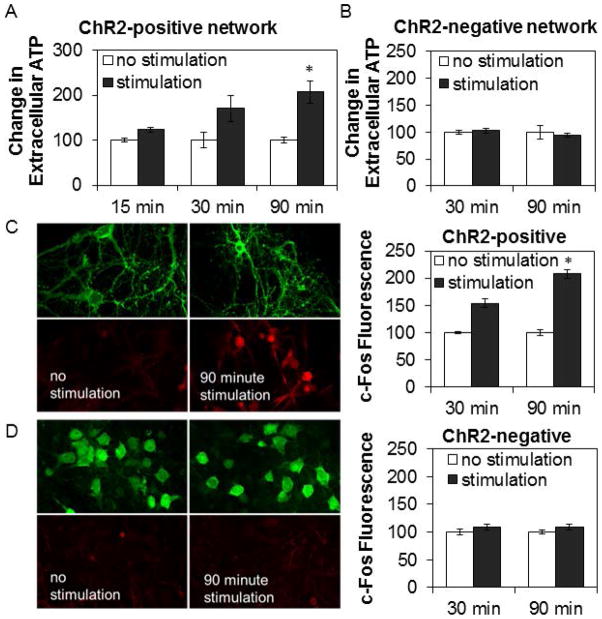
Figure 6. Light stimulation of ChR2-positive networks progressively elevated levels of extracellular ATP and expression of c-Fos in neurons.
Graphs show means ± SE. Image dimensions: 115 μm by 75 μm. A. Optogenetic stimulation of channelrhodopsin-2(ChR2)-positive networks for 30 and 90 min increased levels of extracellular ATP compared to time-matched non-stimulated control networks. Number of networks with no stimulation/stimulation: 3/5 (15 min), 11/11 (30 min), 18/21 (90 min) from 4 preparations. B. Stimulation of ChR2-negative networks did not show any increase in levels of extracellular ATP over 30 or 90 min of light stimulation. Number of networks with no stimulation/stimulation: 3/3 (30 min), 3/4 (90 min). C. & D. Cells were fixed after light stimulation for determination of c-Fos expression (red), an early gene expressed in neurons in response to activation. Stimulation of ChR2-positive networks (C.), but not of ChR2-negative networks (D.), for 30 and 90 min enhanced c-Fos (red) expression compared to non-stimulated controls. YFP fluorescence (green) from ChR2-YFP was used to identify neurons. For ChR2-negative networks, neurons were stained with Alexa-488 (green) conjugated neuronal nuclei marker, NeuN. Fluorescence intensity for individual cells (200 or more per network) was measured. Bar graphs show relative change in average cellular fluorescence for stimulated networks relative to time-matched non-stimulated control networks. Number of networks with no stimulation/stimulation for ChR2-postive networks: 3/3 (30 min), 3/4 (90 min); no stimulation/stimulation for ChR2-negative networks: 3/3 (30 min), 3/3 (90 min). * indicates a significant difference (p<0.01) from pre-stimulation values.

