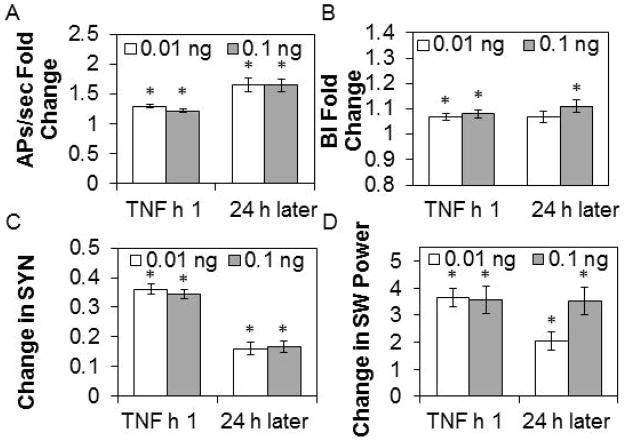
Figure 9. TNF addition alters APs/sec, BI, SYN values, and SW power.
Values are means ± SE of absolute and fold changes from values obtained during the h before addition of 0.01 ng or 0.1 ng ng tumor necrosis factor alpha (TNF), 1 h after addition and 24 h after addition. A. Fold change from pre-TNF addition values in action potentials (APs)/sec (0.01 ng, n= 234 channels; 0.1 ng, n=219 channels). B. Fold change from pre-TNF addition values in burstiness index (BI) (0.01 ng, n=234 channels; 0.1 ng, n=219 channels). C. Change from pre-TNF addition values in SYN values (0.01 ng, n=520 channel pairs; 0.1 ng, n=416 channel pairs). D. Change (μV2) from pre-TNF addition values in SW power (0.01 ng, n=234 channels; 0.1 ng, n=221 channels).
* indicates a significant difference (p<0.01) from pre-TNF addition values.

