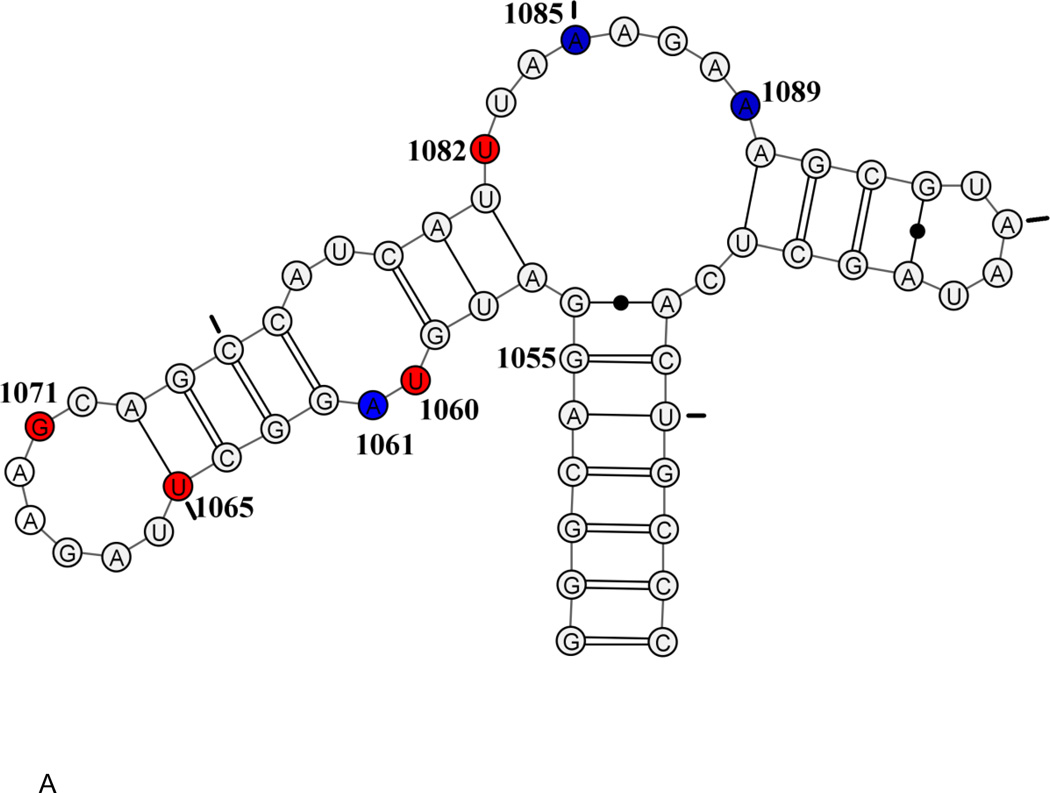
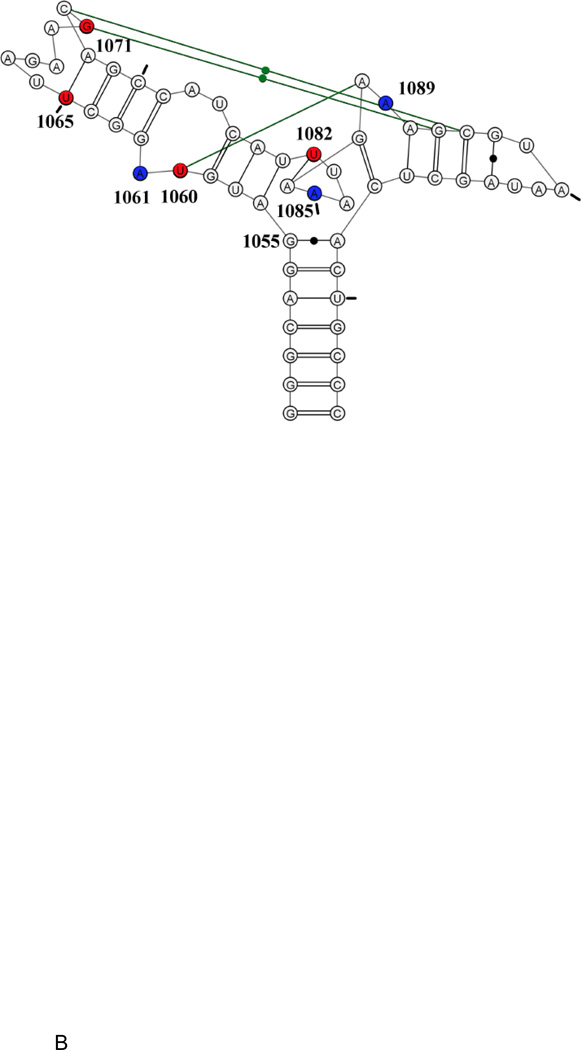
Figure 1.
E coli U1061A GAC. A: secondary structure model. B: tertiary structure model. Nucleotides U1065-A1073 form a T-loop; nucleotides U1082-A1086 form a triloop within the junction region; nucleotides G1093-A1098 form a U-turn. Green connecting lines indicate long-range hydrogen bonds. Blue: 2AP-substituted 1061, 1085, 1089. Red: 15N-nucleotides U1060, U1065, G1071, U1082. Tic marks every 10 nucleotides.


