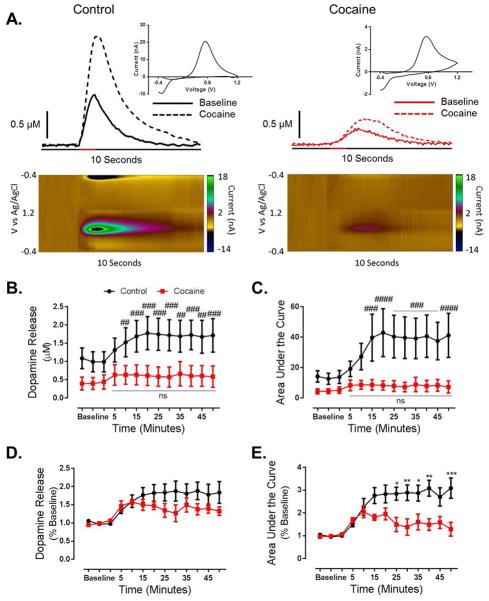
Figure 3. Cocaine self-administration results in tolerance to the ability of cocaine to increase dopamine.
(A) Representative traces and pseudo-color plots from control (left) and cocaine self-administration (right) animals demonstrating decreased stimulated (60 pulse, 60 Hz, denoted by red bar on x-axis) dopamine transmission following a cocaine challenge (10 mg/kg, i.p.). Cocaine was injected immediately following the final baseline collection, and representative traces were taken 15 minutes (3 collections) following injection. Inset: cyclic voltammogram from peak of post injection representative trace. (B) Group data representing severely blunted dopamine release at baseline and following a cocaine challenge in cocaine self-administration animals as compared to controls. (C) Area under the curve is attenuated at baseline and following a cocaine challenge in cocaine animals. (D) When represented as a percent of baseline, the effect of a cocaine challenge on dopamine release is attenuated by a history of cocaine self-administration. Although an ANOVA revealed a main effect of time, and a time x group interaction, Bonferroni post hoc analysis did not reveal a significant difference at any of the time points. (E) When represented as a percent of baseline the effect of a cocaine challenge on area under the curve is blunted in cocaine animals. #, p < 0.05 vs. baseline; ##, p < 0.01 vs. baseline; ###, p < 0.001 vs. baseline; ####, p < 0.0001 vs. baseline, *, p < 0.05 vs. cocaine; **, p < 0.01 vs. cocaine; ***, p < 0.001 vs. cocaine; ****, p < 0.0001 vs. cocaine

