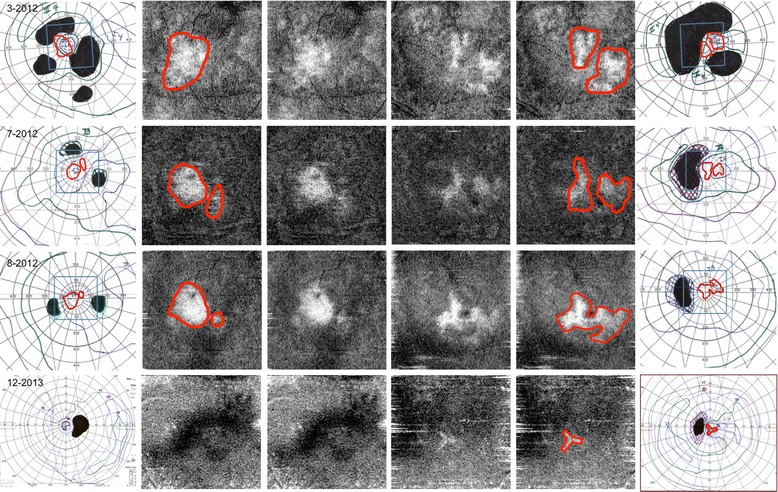
Fig. 4.

The outer columns show Goldmann visual fields (GVF) from the right eye and left eye. The second and fifth columns shows the en face OCT (Cirrus) scan with the intact central area of photoreceptors (PRs) delineated with a manually drawn red line. The red line from en face images has been transposed onto the GVF images on the corresponding dates. The middle columns show the original en face images. Initially, the size and shape of the PRs correspond to the preserved island of central vision, but as the GVF improves, the area of intact PRs declines. Eventually, there is complete loss from the PR signal in the right eye, which corresponds to a severely depressed GVF on December 2013 seen as restriction of the I4 isopter to the center 5°. The left eye also shows severe vision loss on the final GVF. The poor quality of the later en face images is due to increasing artifact when generating the en face images due to the retina thinning over time. (The en face images on July 2012 were created with a modified method using linear interpolation of the RPE slice since the automated technique was not available for these images)
