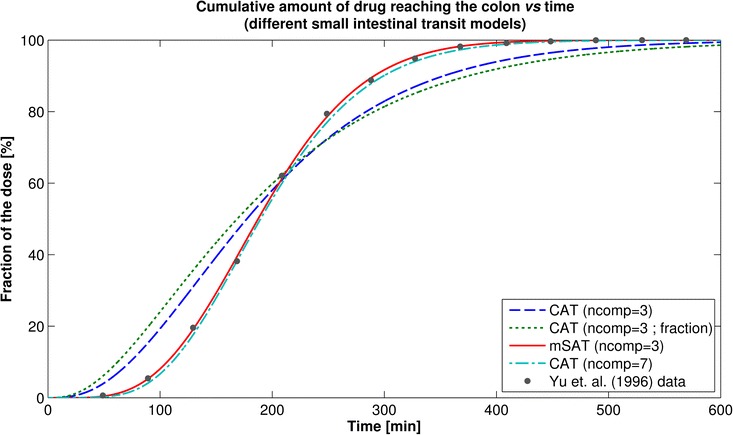
Fig. 3.

Comparison between different small-intestinal transit models to the describe SITT data. The lines represent the cumulative percentage of the dose reaching the colon for the different SITT models. Red solid line, mSAT model (Weibull transfer between segments); dot- dashed cyan line, full CAT model (seven transit compartments); dashed blue line, CAT model with only three compartments (same first-order transit rate constant for all the segments); dotted green line, CAT model with only three compartments, where the transit was fractionally divided for each segment (based on the segment’s length). The solid dots are the observed cumulative percentage of the dose reaching the colon, as per reference (32)
