
Fig. 3.
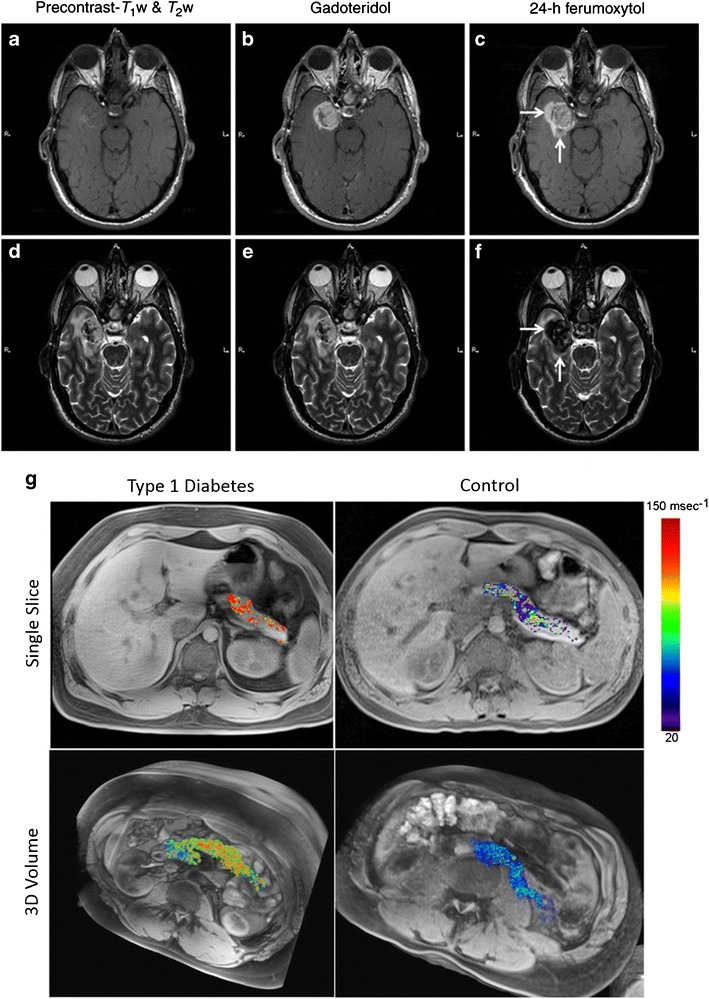
Clinical pathological imaging using ferumoxytol nanoparticles. MRI of patient with a known glioblastoma multiforme. T1-weighted MRI images: a precontrast, b gadoteridol enhanced, and c 24-h post-ferumoxytol enhanced. T2-weighted MRI images: d precontrast, e gadoteridol enhanced, and f 24-h post-ferumoxytol enhanced. White arrows indicate enhancement regions present in ferumoxytol groups but not in gadoteridol groups. g Ferumoxytol MRI in a representative patient with type-1 diabetes (left) and a non-diabetic control patient (right). Single slices (top) and 3D volumes (bottom) show increased ferumoxytol accumulation in a diabetic patient as compared with control. a–f Reprinted from (69), by permission of Oxford University Press. g Adapted from (71)