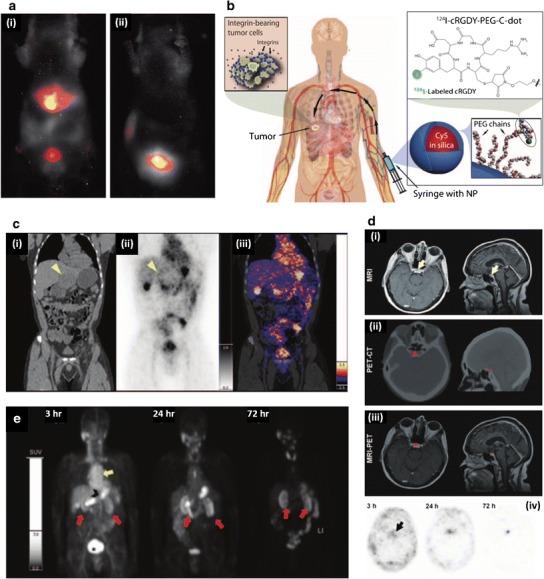
Fig. 4.

Preclinical and clinical performance of C-Dots. a In vivo fluorescent imaging in nude mice, 45 min after injection, with: i bare C-Dots, which show accumulation in liver and bladder, and ii PEG-coated C-Dots, which show accumulation only in bladder. PEG coating effectively allows C-Dots to avoid reticuloendothelial clearance organs, such as the liver, and eventually accumulate in the bladder prior to renal clearance. b C-Dot schematic showing: integrin-targeting cRGDY functionality, 124I-labeling to facilitate PET imaging, Cy5-loaded core to facilitate fluorescent imaging and PEG coating to allow immune system avoidance. c i Coronal CT showing left hepatic lobe metastasis (yellow arrowhead), ii coronal PET image, 4-h post-C-Dot injection, showing particle accumulation around tumor periphery (yellow arrowhead), and iii co-registered PET-CT, 4-h post-C-Dot injection, highlighted C-Dot accumulation in tumor periphery in a patient with anorectal mucosa melanoma, with liver metastasis. d i MRI, 72-h post-C-Dot injection, showing a cystic focus in the anterior pituitary gland, ii PET-CT imaging showing C-Dot accumulation in pituitary lesion, and iii MRI-PET showing overlap of C-Dots from PET with pituitary lesion from MRI in a patient with a pituitary microadenoma. iv Time-lapse PET imaging highlighting the progressive accumulation of C-Dot activity up to 72-h post-injection. e In a patient with impaired renal function and chemotherapy related nephrotoxicity, PET imaging showed C-Dot activity in the cardiac blood pool (yellow arrow), small bowel (black arrowhead), renal cortices (red arrows), and bladder (asterisk); 72 h later, C-Dot activity remains in the renal cortices. a Adapted with permission from (93). Copyright (2009) American Chemical Society. b–e From (89). Adapted with permission from AAAS
