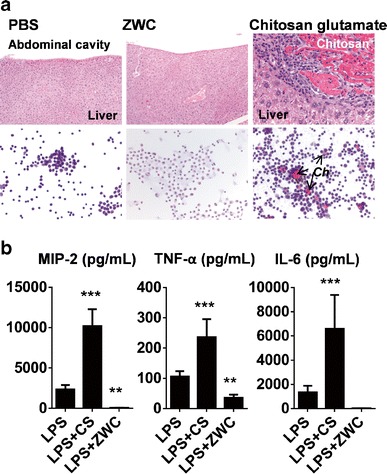
Fig. 1.

a (Top) Hematoxylin and eosin (H&E) staining of liver sections of different treatment groups. (Bottom) Cytology of the peritoneal fluid from different treatment groups using H&E staining. Ch: extracellular chitosan deposits. b Effect of chitosan treatment (all in 2 mg/mL) on cytokine release from LPS (1 μg/mL)-challenged macrophages. **p < 0.01; ***p < 0.001 vs. LPS. LPS lipopolysaccharide, CS chitosan, ZWC zwitterionic chitosan. Adapted from (1)
