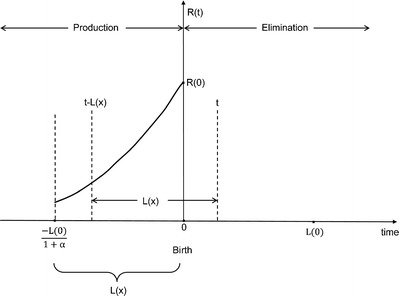
Fig. 2.

Non-SS fetal erythropoiesis in newborn infants. The solid line represents the changes in fetal erythropoiesis rate up to the time of birth. R(0) represents the RBC production rate at time of birth (t = 0). The fetal erythropoiesis rate is proportional to the in utero infant body weight (Eq. 2). Fetal RBC life span, L(x), varies linearly with time (Eq. 3)
