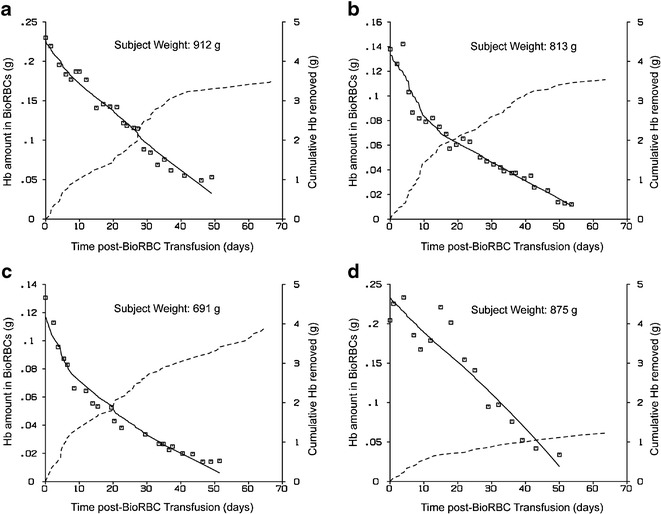
Fig. 4.

a–d Model fit to Hb amount-time data for four subjects. The open squares represent Hb amount data points and the solid line shows the model fit (Eq. 10). The dashed line represents the cumulative amount of Hb removed from the infant during the same time interval
