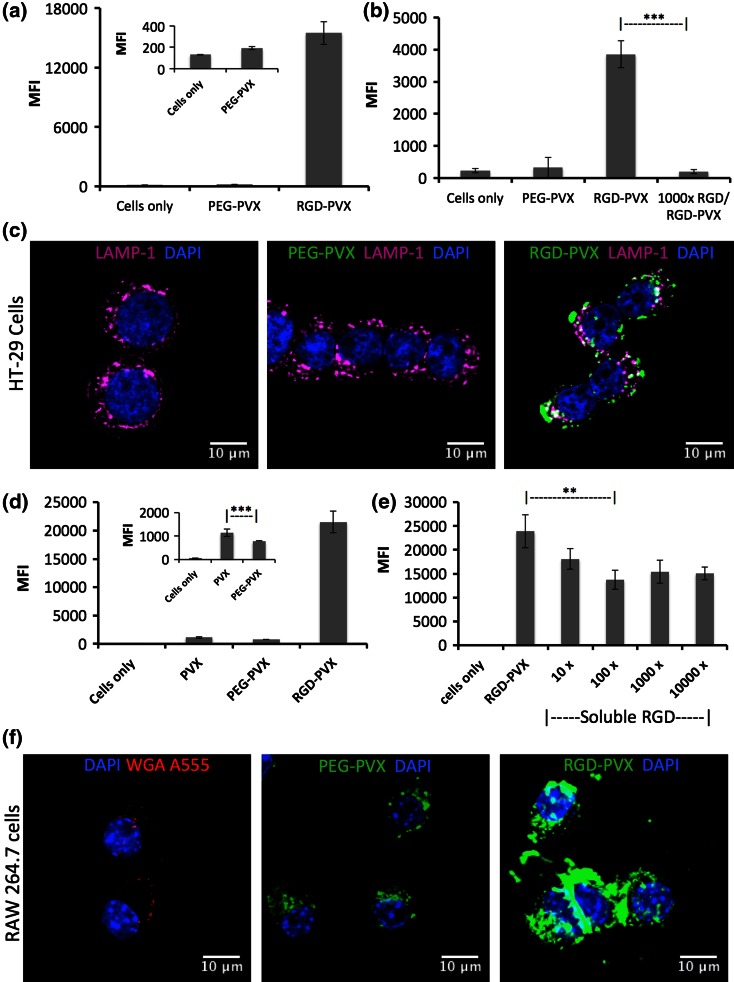
Figure 7.
The analysis of PEG-PVX and RGD-PVX interactions with and uptake into cells using flow cytometry and confocal microscopy. (a + d) Flow cytometry was used to determine the interactions between PVX particles and HT-29 cancer cells (a, b) or RAW264.7 macrophages (d, e). The mean fluorescence intensity (MFI) is plotted and error bars indicate the standard deviation (n = 3). (b + e) Competition binding assays using RGD-PVX and free RGD peptides. (c + f) Confocal microscopy shows that RGD-PVX is taken up more efficiently than PEG-PVX by HT-29 cells and RAW264.7 macrophages. Cells were stained with DAPI (blue) to show the nucleus and with the endosomal marker LAMP-1 (pink; in HT-29 cells) or WGA (red; RAW cells). Colocalization of the particles and the endosomal marker indicates cellular uptake. Scale bars = 10 μm.

