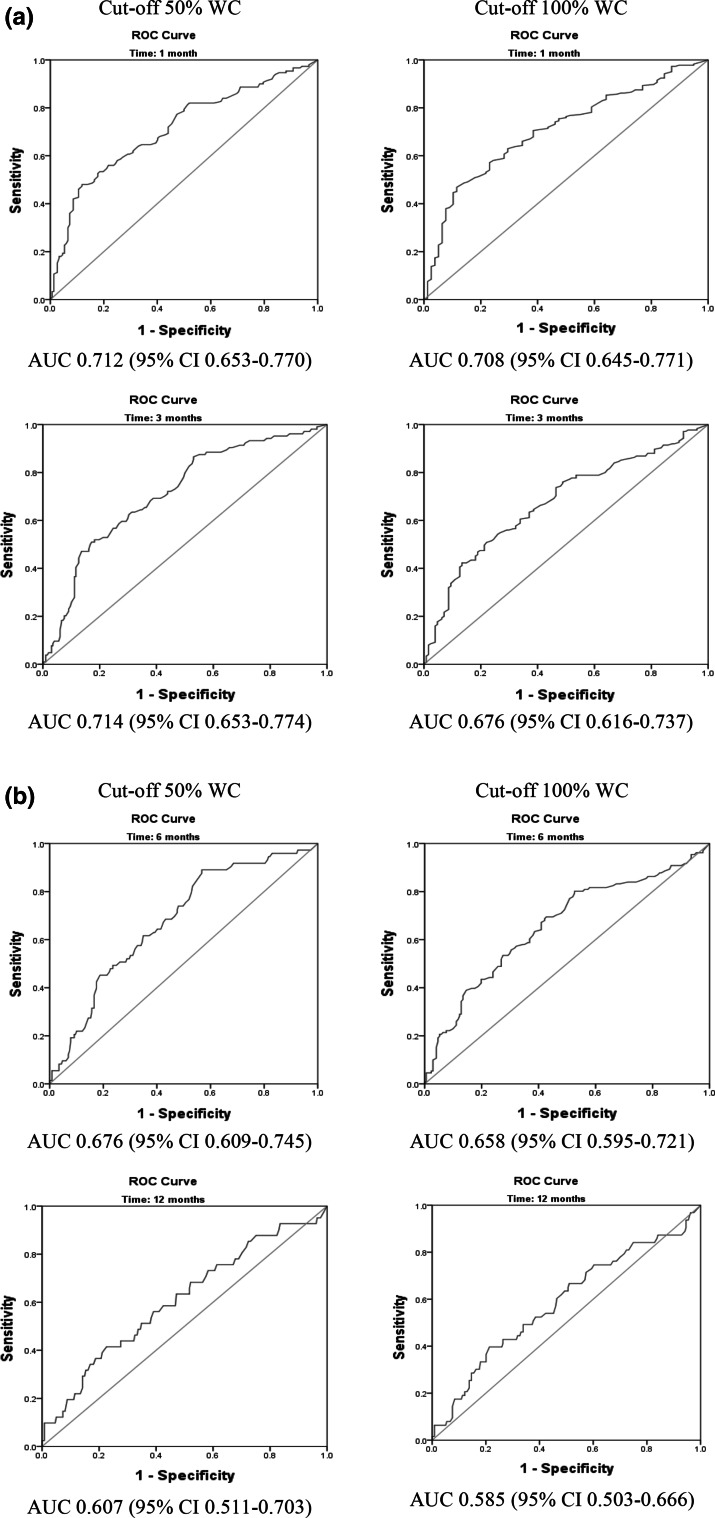
Fig. 3.
(AUC, Part 1). ROC curve of SFS total score at baseline with cut off values of work capacity 50 or 100 % at 1 month (first row) and 3 months (second row) follow-up to predict non return to work. (AUC, Part 2). ROC curve of SFS total score at baseline with cut off values of workcapacity 50 or 100 % at 6 months (third row) and 12 months (fourth row) follow-up to predict non return to work. WC workcapacity, AUC area under the curve, CI confidence interval

