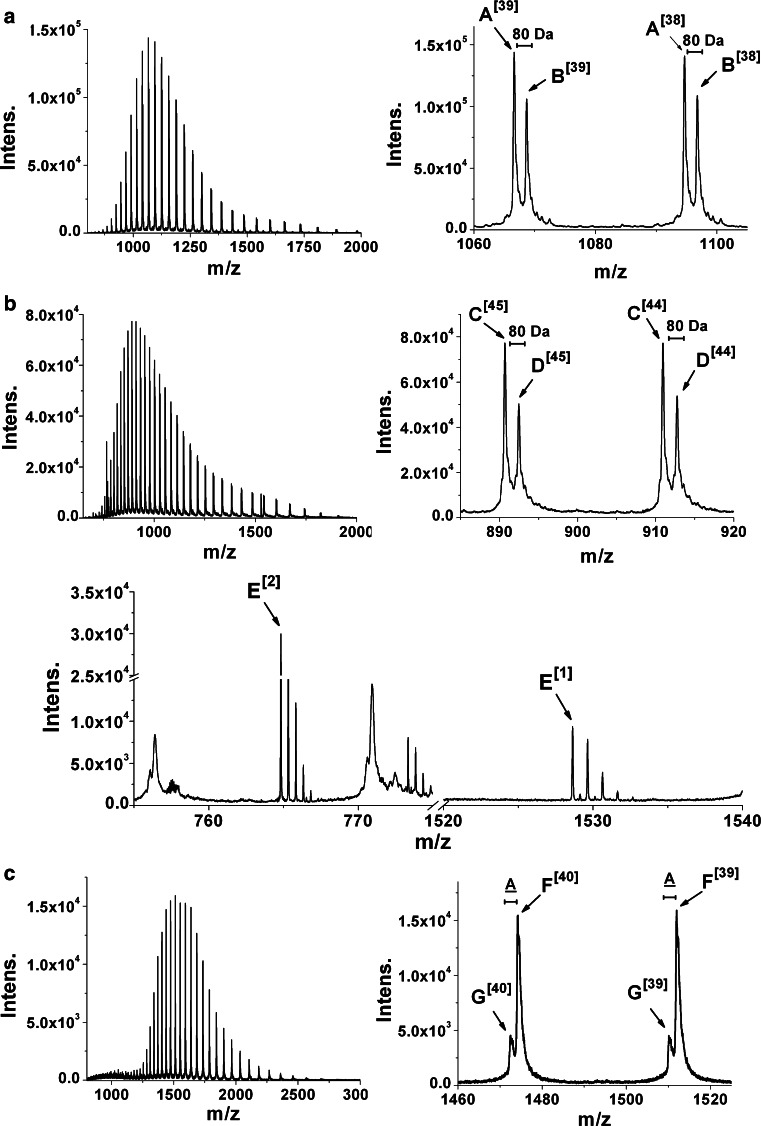
Fig. 4.
Positive mode ESI-QTOF mass spectra of purified active and latent cgAUS1 samples. Entire and magnified mass spectra of acidified sample 1 containing active cgAUS1. a Under non-reducing conditions (untreated). b Under reducing conditions (preincubated with 50 mm DTT). c Mass spectra of sample 5 containing acidified latent cgAUS1 under non-reducing conditions

