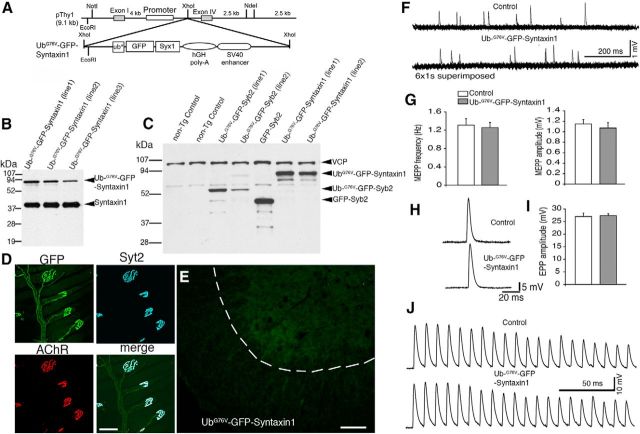
Figure 10.
Normal synaptic activity at the NMJs in UbG76V-GFP-Syntaxin1 mice. A, A schematic diagram of the design of the construct for generating UbG76V-GFP-Syntaxin1 transgenic mice. Syx1, Syntaxin1. B, Western blot analysis of spinal cord homogenates from three lines of UbG76V-GFP-Syntaxin1 transgenic mice, probed with antibodies against syntaxin1. C, Western blot analysis of spinal cord homogenates, illustrating expression levels of transgene among UbG76V-GFP-Syntaxin1, UbG76V-GFP-Syb2, and GFP-Syb2 mice. D, The NMJ morphology in the triangularis sterni muscle of an 8-month-old UbG76V-GFP-Syntaxin1 transgenic mouse, labeled by anti-Syt2 antibodies and Texas-Red-conjugated α-bungarotoxin. Note that the nerve terminals are intensely labeled by GFP and Syt2. E, Frozen sections (12 μm thickness) of the ventral horn of spinal cords from UbG76V-GFP-Syntaxin1 mice (8 months of age), viewed under epifluorescence. GFP fluorescence is uniformly distributed. F, Sample traces of mEPPs recorded from the lumbrical muscles from UbG76V-GFP-Syntaxin1 and control mice (8 months of age). G, Quantification of mEPP frequency (UbG76V-GFP-Syntaxin1 mice: 1.26 ± 0.11 Hz, n = 22; control mice: 1.31 ± 0.14 Hz, n = 17) and amplitude (UbG76V-GFP-Syntaxin1 mice: 1.07 ± 0.10 mV, n = 22; control mice: 1.15 ± 0.08 mV, n = 17). Both mEPP frequency and amplitude are similar between UbG76V-GFP-Syntaxin1 and control mice. H, Sample traces of EPPs recorded in the lumbrical muscles from UbG76V-GFP-Syntaxin1 and control mice (8 months of age). I, Quantification of EPP amplitude. EPP amplitudes are similar between UbG76V-GFP-Syntaxin1 mice (27.29 ± 0.84 mV, n = 22) and control mice (26.99 ± 1.34 mV, n = 17). J, EPPs recorded from the lumbrical muscles from UbG76V-GFP-Syntaxin1 and control mice (8 months of age) in response to a 1 s, 100 Hz train stimulation (only the first 20 EPPs are displayed). Similar responses were detected from UbG76V-GFP-Syntaxin1 and control mice. Scale bars: D, 30 μm; E, 100 μm.

