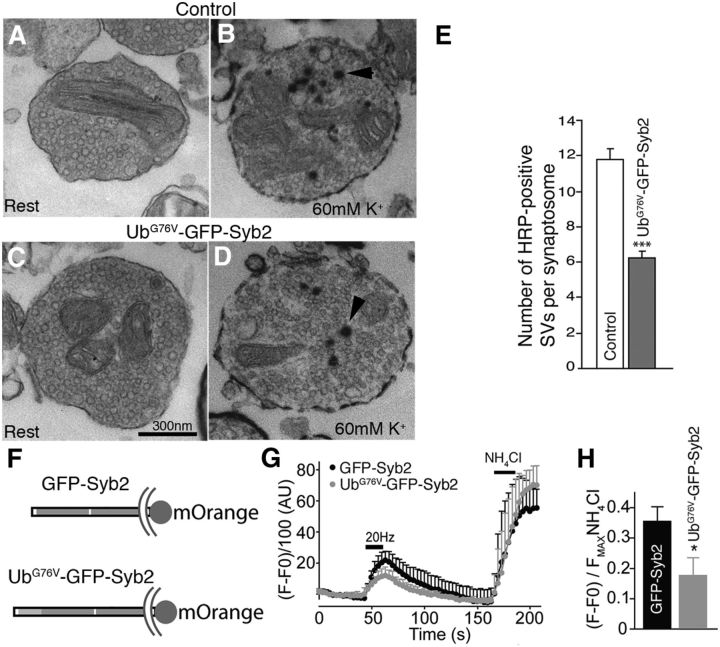
Figure 14.
Impairments in synaptic vesicle endocytosis and membrane trafficking in UbG76V-GFP-Syb2 mice. A–D, EM images of synaptosomes isolated from control (A, B) and UbG76V-GFP-Syb2 mice (C, D). A and C show examples of synaptosomes at rest; B and D show examples of synaptosomes containing HRP-labeled SVs (arrowheads) after incubation with 60 mm KCl for 15 min. E, Bar graphs showing the average number of HRP-positive SVs per synaptosome after depolarization with 60 mm KCl for 15 min. A total of 215 synaptosomes from UbG76V-GFP-Syb2 mice (N = 3) and 209 synaptosomes from control mice (N = 3) were analyzed. The average numbers of HRP-positive SVs per synaptosome from UbG76V-GFP-Syb2 mice are significantly (p = 0.0493) reduced in UbG76V-GFP-Syb2 mice (6.24 ± 1.66 vesicles, N = 3 mice) compared with control mice (11.42 ± 1.55 vesicles, N = 3 mice). F, Schematic diagram of GFP-Syb2-mOrange and UbG76V-GFP-Syb2-mOrange. G, Average traces of fluorescence changes in synaptic boutons expressing GFP-Syb2-mOrange (n = 8) and UbG76V-GFP-Syb2-mOrange (n = 9). H, Analysis from the same experiments as in G. The peak fluorescence generated during 20 Hz stimulation is normalized to the peak fluorescence generated after NH4Cl treatment. The average peak values in synaptic boutons expressing UbG76V-GFP-Syb2-mOrange are significantly (p = 0.0067) lower than those expressing GFP-Syb2-mOrange. Scale bar: A–D (in C), 300 nm.

