Figure 7.
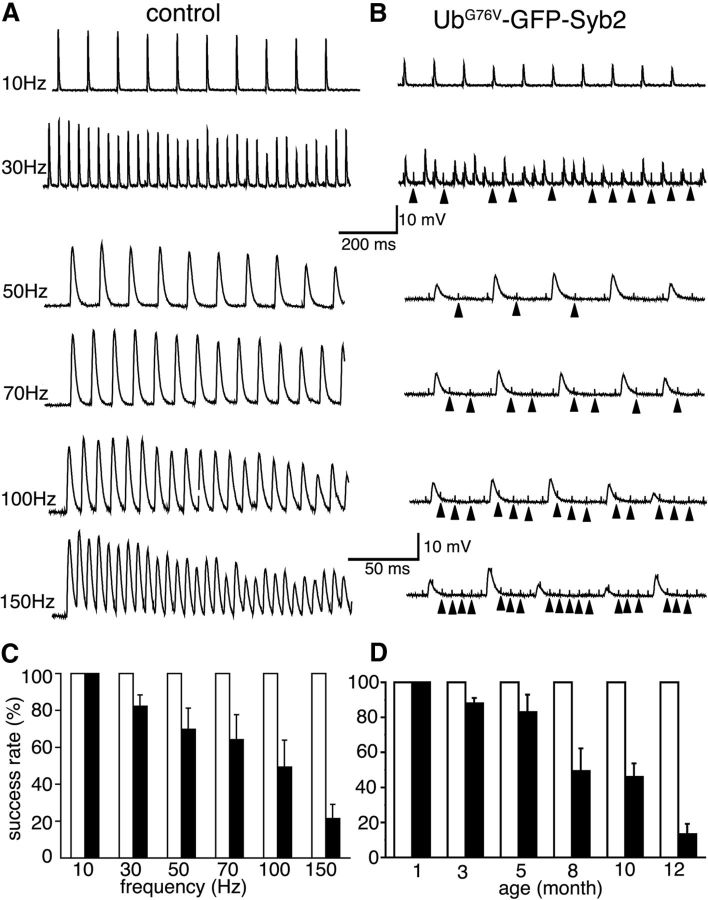
Use-dependent impairment of neuromuscular synaptic transmission in UbG76V-GFP-Syb2 mice. A, B, Sample EPP traces evoked by a 1-s-duration train containing an increasing frequency of stimuli (10, 30, 50, 70, 100, and 150 Hz). Traces in each column are recorded from the same muscle cell. In control mice (A), EPPs follow closely with increasing frequency of stimulation from 10–150 Hz. In UbG76V-GFP-Syb2 mice, EPPs fail to follow at high frequencies of stimulation; transmission failure first appears at 30 Hz (B, arrowheads point to stimulus artifact). C, Quantification of success rates (the percentage of EPP responses as a function of the frequency of stimulation) between control mice (open bar) and UbG76V-GFP-Syb2 transgenic mice (filled bar) at 10, 30, 50, 70, 100, and 150 Hz. With increasing stimulation frequency, the rates of successful synaptic transmission are significantly decreased in UbG76V-GFP-Syb2 mice. Control mice: n = 15 muscle fibers, N = 3 mice; UbG76V-GFP-Syb2 mice: n = 18 muscle fibers, N = 3 mice. p = 0.0107 (30 Hz); p = 0.0135 (50 Hz); p = 0.0132 (70 Hz); p = 0.0014 (100 Hz); and 1.367 × 10⁻⁸ (150 Hz). D, Quantification of success rates as a function of age in response to a 1 s train at 100 Hz (1 s) in control mice (open bar) and UbG76V-GFP-Syb2 mice (filled bars). The number of muscles (n) and the number of mice (N) analyzed at each age group are listed as follows: 1-month-old group: control mice, n = 15, N = 3; UbG76V-GFP-Syb2 mice, n = 15, N = 3; 3-month-old group: control mice, n = 15, N = 3; UbG76V-GFP-Syb2 mice, n = 14, N = 3, p = 0.005; 5-month-old group: control mice, n = 14, N = 3; UbG76V-GFP-Syb2 mice, n = 15, N = 3, p = 0.0089; 8-month-old group: control mice, n = 12, N = 3; UbG76V-GFP-Syb2 mice, n = 12, N = 3, p = 5.493 × 10⁻⁶; 10-month-old group: control mice, n = 15, N = 3; UbG76V-GFP-Syb2 mice, n = 15, N = 3, p = 3.891 × 10⁻⁷; 12-month-old group: control mice, n = 12, N = 3; UbG76V-GFP-Syb2 mice, n = 12, N = 3, p = 7.693 × 10⁻⁸). Calibration: the line underneath the 30 Hz example applies to both the 10 and 30 Hz traces; the line underneath the 150 Hz example applies to 50, 70, 100, and 150 Hz panels (traces represent the first 200 ms of the recording).

