
Figure 3.
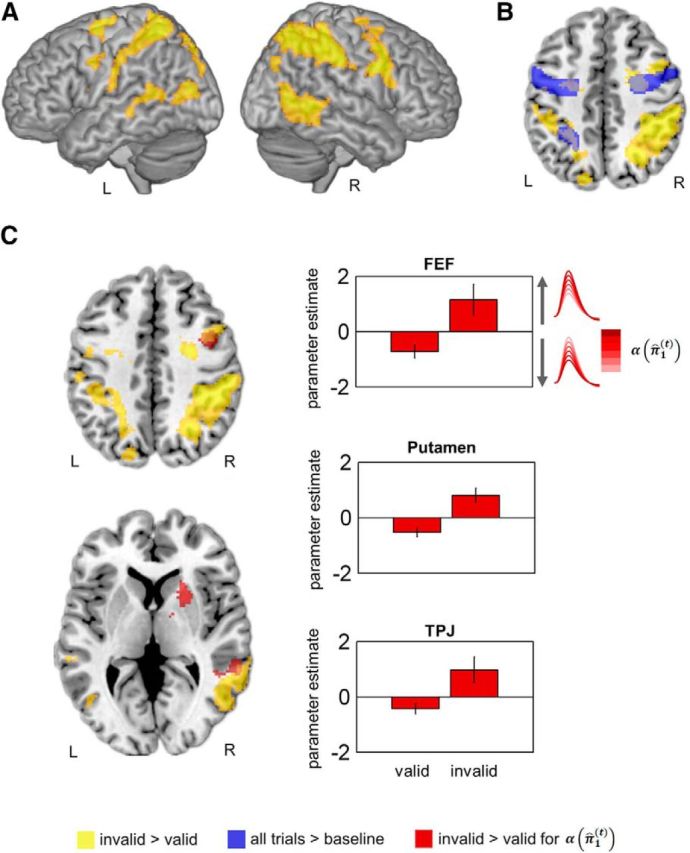
Results of the GLM analysis. A, Reorienting network as revealed by a t-contrast (invalid > valid) for the main HRF regressor. B, Overlap between the saccade network and the reorienting network in the FEF. C, Precision-dependent differences between invalid and valid trials as revealed by a t-contrast (invalid > valid) for the parametric modulation with α(π̂1(t)). The bar charts depict the mean parameter (β) estimates (± SEM) for the parametric regressor for valid and invalid trials.