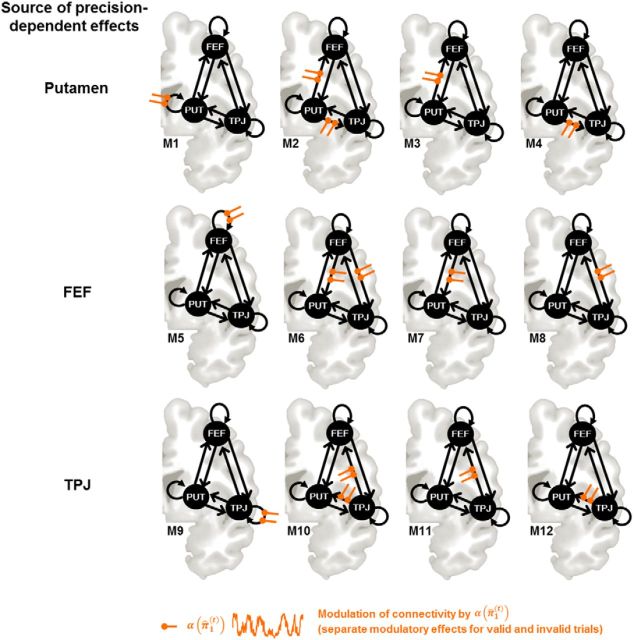
Figure 5.
Illustration of the model space for Bayesian model selection: the sources of the driving inputs were varied to create three model families with 12 models each (PUT and FEF, PUT and TPJ, PUT, FEF and TPJ; families not shown in the figure). In a first step, the three model families were compared to reveal the most likely sources of driving inputs. Subsequently, the optimal model within the winning family was determined. PUT, Putamen.

