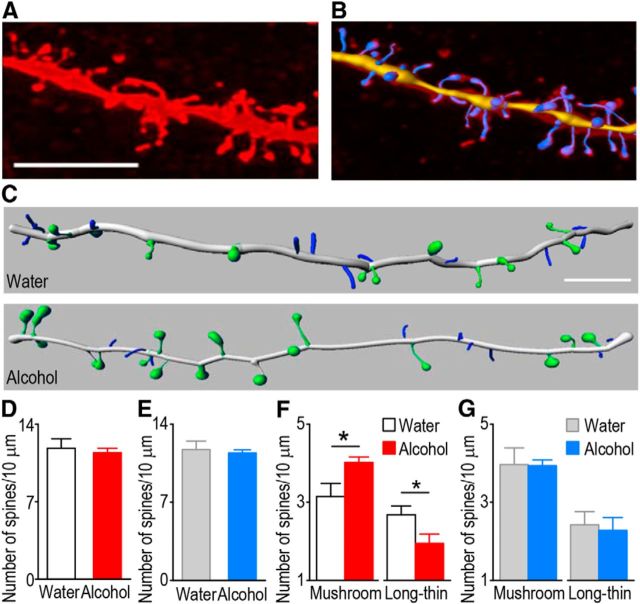
Figure 6.
Alcohol consumption produces an increase in the density of mushroom spines in D1R MSNs of the DMS. D1R or D2R MSNs from water and alcohol groups were labeled with biocytin as above. A, A representative image of a reconstructed dendrite and spines. Scale bar, 5 μm. B, A sample image showing overlap of traced spines and a reconstructed one in A. C, Sample images comparing mushroom spines (green) and long-thin spines (blue) in D1R MSNs from water and alcohol groups. Other types of spines were omitted for clarity. Scale bar, 5 μm. D, E, Bar plot for comparison of the total spine density of D1R MSNs (D) and D2R MSNs (E) between the water and alcohol groups. F, Bar graph summarizing the density of mushroom and long-thin spines in D1R MSNs between the water and alcohol groups; *p < 0.05, t test. G, Alcohol consumption does not alter the density of either mushroom or long-thin spines in D2R MSN of the DMS; n = 8 (Water) and 9 (Alcohol) mice for D and F and 7 (Water) and 8 (Alcohol) mice for E and G.

