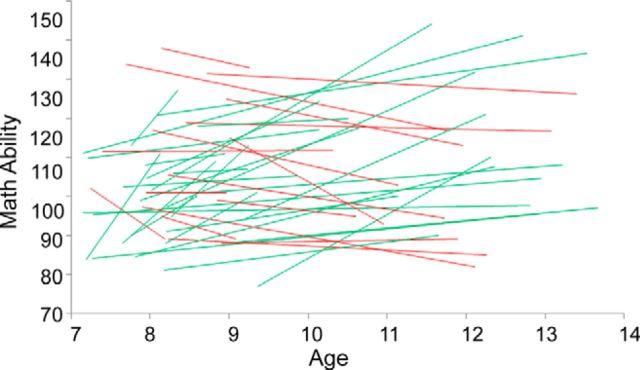
Figure 1.
Growth curves for individual children's (n = 43) standardized score on the WIAT-II Numerical Operations subtest. Lines depict linear regression of Numerical Operations standardized score versus age across longitudinal visits for each child. Children who made gains relative to their peers over time are plotted in green. Those who declined or remained stable are plotted in red. The annualized change (slopes of individual regression lines) is used in subsequent regression and confirmatory cross-validation analyses.

