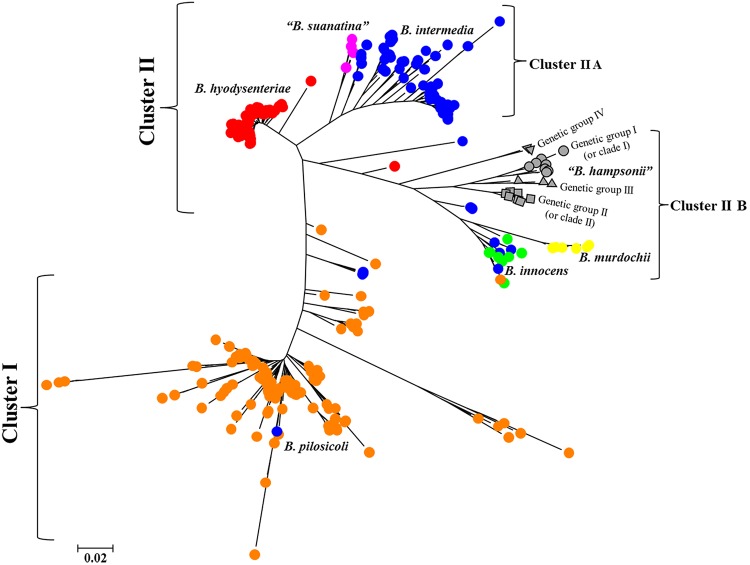
FIG 3.
Radial tree of maximum likelihood analysis portraying the clustering of 326 Brachyspira types (430 isolates) representing seven Brachyspira species. Each unique type was depicted by a colored shape to represent its taxonomic identity. The genetic groups of B. hampsonii were represented by the following filled gray shapes: genetic group I (gray circle), genetic group II (gray square), genetic group III (gray triangle), and genetic group IV (gray inverted triangle). The other six Brachyspira species were represented by filled colored circles as follows: B. hyodysenteriae (red circle), B. suanatina (pink circle), B. intermedia (blue circle), B. murdochii (yellow circle), B. innocens (light green circle), and B. pilosicoli (orange circle). A total of 2,807 positions of 326 Brachyspira types were used to compute the genetic similarity, and the scale unit represents 2 substitutions per 100 nucleotide positions. Two major clusters were identified: cluster I consisting of B. pilosicoli and cluster II consisting of another six Brachyspira species. Cluster II showed two smaller subclusters as cluster IIA (B. hyodysenteriae, B. suanatina, and B. intermedia) and cluster IIB (B. hampsonii, B. murdochii, and B. innocens).

