
FIG 1.
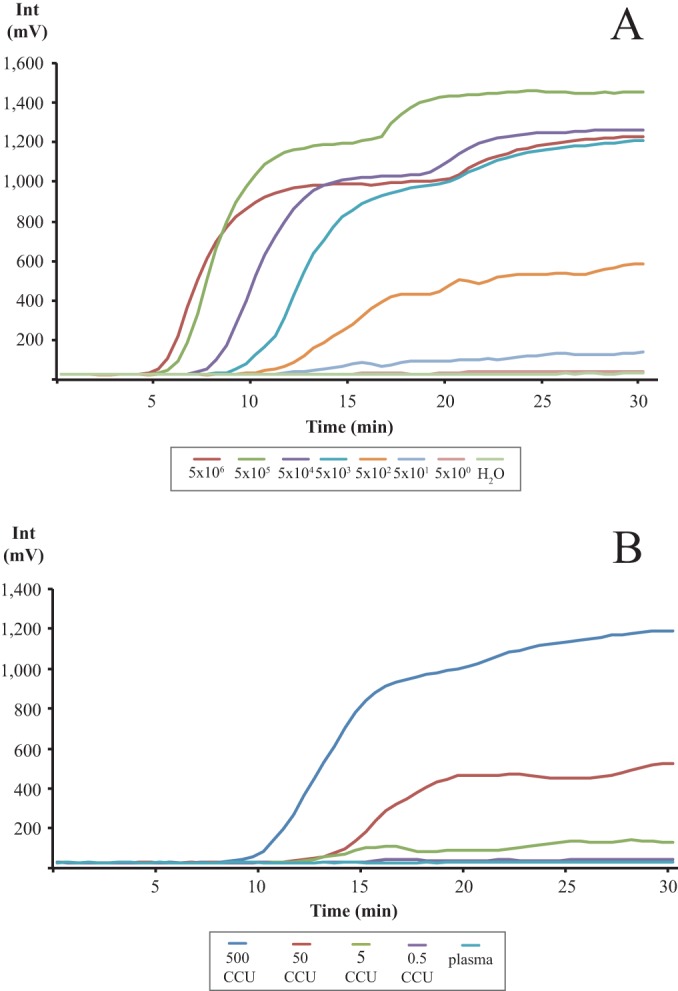
Graph depicting the RPA amplification (development of fluorescence, mV) over time (minutes). (A) M. capricolum subsp. capripneumoniae DNA (5 × 10⁶ to 5 × 100 copies/reaction) diluted in nuclease-free water. (B) M. capricolum subsp. capripneumoniae CCU (500 to 0.5 CCU/reaction) spiked in plasma from a healthy goat. Each graph represents the mean value from eight individual runs.