
FIG 1.
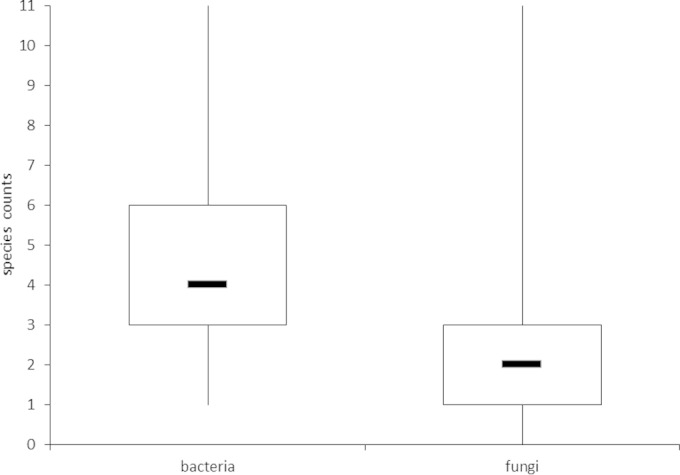
Boxplots of species counts per sample for bacteria and fungi. Boxes are defined by upper and lower quartiles, whereas bars within boxes indicate the median number of OTUs. The ends of the whiskers represent the minimum and maximum species counts found in individual samples.