
FIGURE 1.
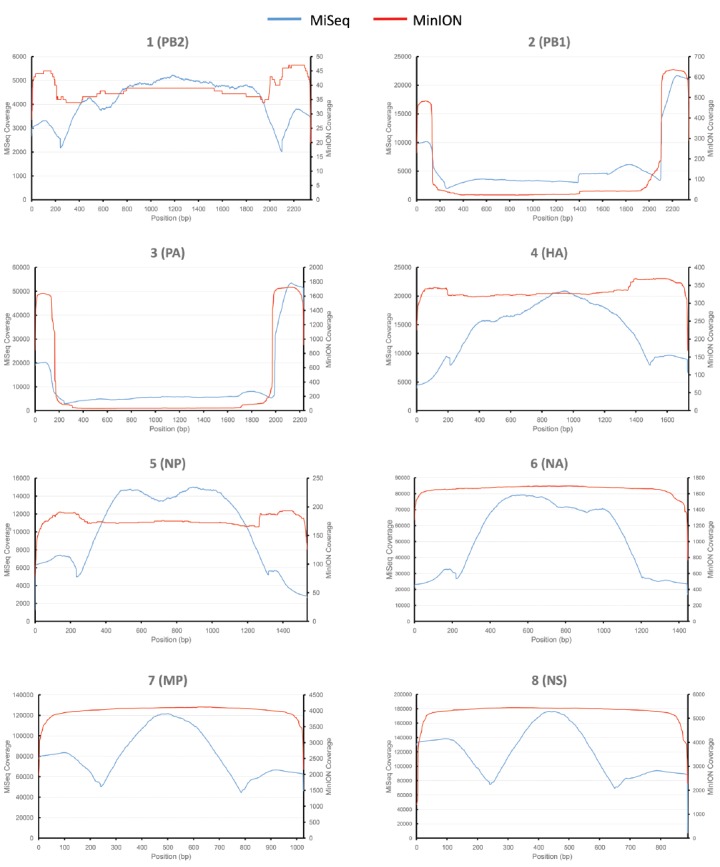
Figure 1. Comparative analysis of influenza genome coverage, comparing the Illumina MiSeq, and the MinION nanopore sequencer. Sequence coverage profiles for each influenza gene segment are plotted. The left-hand y-axis shows x-fold coverage for the Illumina MiSeq. The right-hand y-axis shows x-fold coverage for the MinION. The x-axis shows the position in the gene.