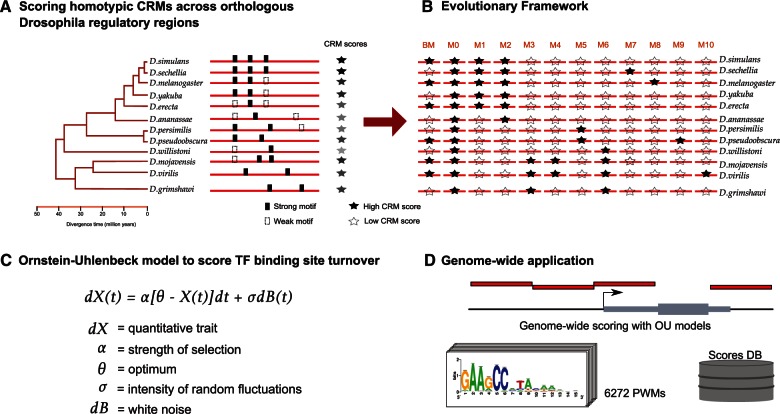
Fig. 1.
Application of the OU model at the CRM score level. (A) Calculation of CRM scores for a given PWM is performed with an HMM that aggregates over all possible matches to the PWM. A genomic region in Drosophila melanogaster is shown, alongside all the orthologous regions in the other 11 species (obtained from whole-genome alignments by liftOver). (B) The evolutionary scenarios considered are BM; M0: one global optimum across species; and nine models presenting a branch-specific optimum. M1: melanogaster subgroup optimum; M2: melanogaster group optimum; M3: D. mojavensis, D. virilis, and D. grimshawi shared optimum; M4: D. mojavensis and D. virilis shared optimum; M5: obscura group optimum; M6: D. willistoni, D. mojavensis, D. virilis, and D. grimshawi shared optimum; M7: D. sechellia specific optimum; M8: D. melanogaster specific optimum; M9: D. pseudoobscura specific optimum; M10: D. virilis specific optimum. (C) The OU model formula assess the evolution of the quantitative trait X (here the CRM score) across phylogenetic time; dX(t) = α [θ − X(t)]dt + σ dB(t), where the term alpha (α) represents the action of selection; θ the optimum trait value, dB(t) is the ensemble of independent normally distributed random variables, and σ measures the intensity of the random fluctuations in the evolutionary process. (D) Application of the OU model across the entire Drosophila regulatory genome (136K regions, Herrmann et al. 2012) for all selective regimes and for a collection of 6,272 PWMs.

