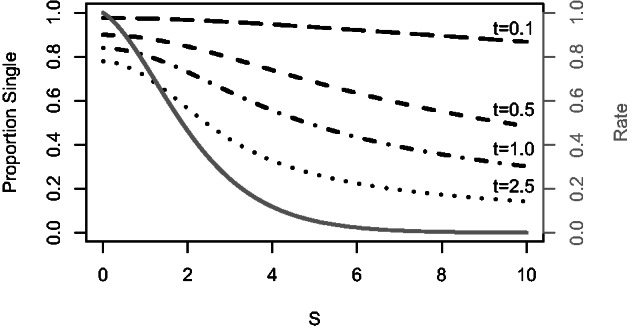
Fig. 2.

Effect of coevolutionary selective pressure, S, in a binary model on the relative rate of coevolution (gray line), and the relative frequency of single observable changes at different evolutionary times, t, in units of expected numbers of substitutions (black dashed lines).
