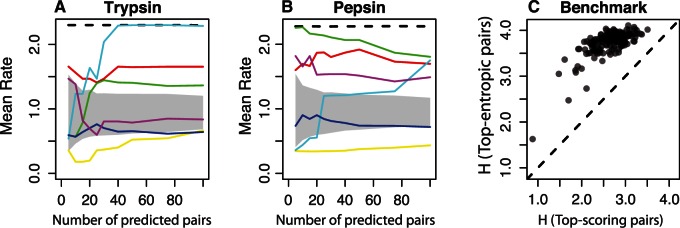
Fig. 5.
Evolutionary basis of methods. In the “well-defined” phylogenetic scenarios, we calculated the mean rate for each pair as the average of the two single evolutionary rates. Then, we calculated the median of the sample of mean rates. (A, B) Median of the averaged evolutionary rate for the selected pairs. Lines are as follows: Black-dashed, MI; red, ; yellow, ; green, MIp; cyan, MIadj; blue, PSICOV; purple, DI. Shaded area shows the expected mean rate for a specific number of predictions. (C) Median entropy H of the selected pairs compared with the median H for the top-entropic pairs for the proteins in the PSICOV benchmark.

