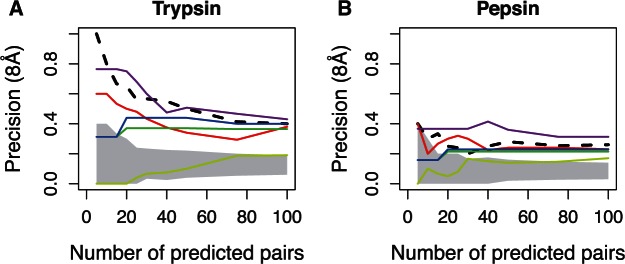
Fig. 6.
Precision of evolution-based metrics. Lines are as follows: Black-dashed, best covariation performance; red, mean of evolutionary rates; yellow, difference (variance) between evolutionary rates; green, MPind; blue, MPdep; purple, . Shaded area shows the random precision for a specific number of predictions.

