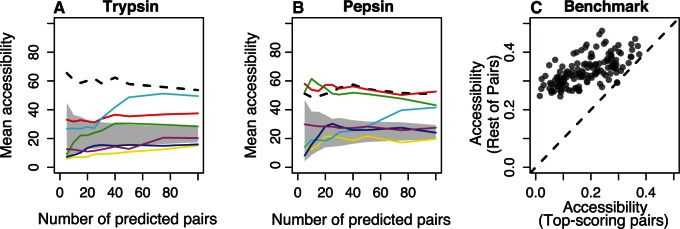
Fig. 7.
Structural basis of methods. (A, B) Median of the weighted average accessibility of the selected pairs. Lines are as follows: Black-dashed, MI; red, ; yellow, ; green, MIp; cyan, MIadj; blue, PSICOV; purple, DI. Shaded area shows the expected mean accessibility for a specific number of predictions. (C) Median weighted average accessibility in the selected pairs compared with the median weighted average accessibility in the rest of pairs for the proteins in the PSICOV benchmark.

