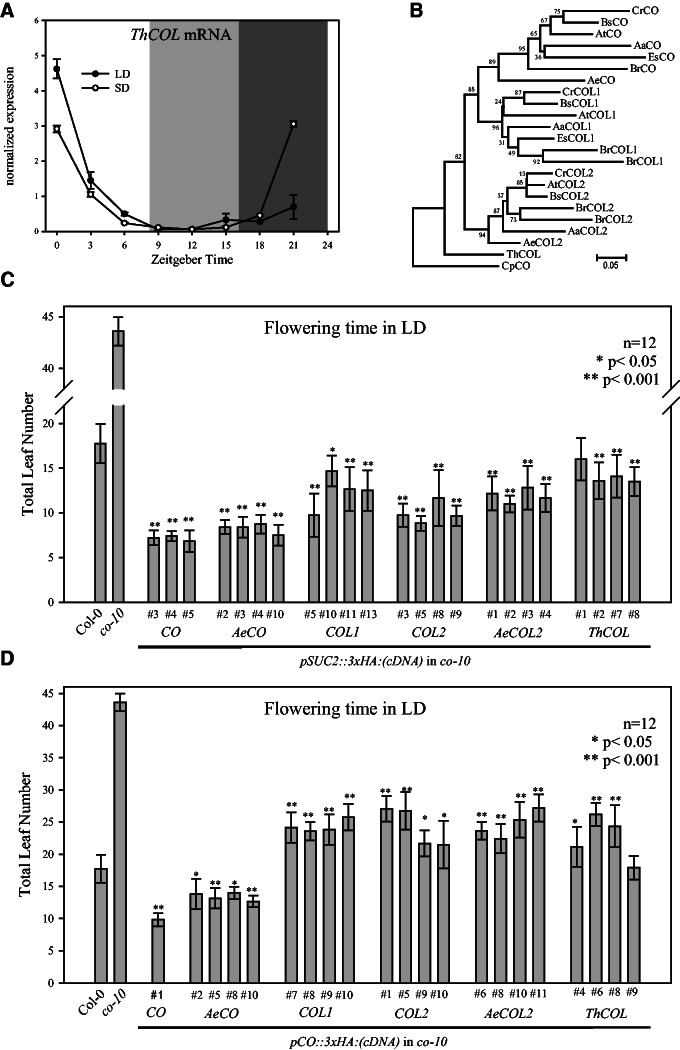
Fig. 3.
Properties of ThCOL in comparison to Brassicaceaen subgroup Ia COL genes. (A) Diurnal expression of ThCOL mRNA in Tarenaya hassleriana seedlings grown under LD or SD conditions. Values are shown as mean ± SD for two biological replicates after normalization to ACTIN. Light gray area indicates darkness in SD, whereas dark gray indicates darkness in both light conditions. (B) Neighbor-joining tree of amino acid sequence from subgroup Ia COL proteins from Arabidopsis thaliana (At), Arabis alpina (Aa), Aethionema arabicum (Ae), Boechera stricta (Bs), Brassica rapa (Br), Capsella rubella (Cr), Carica papaya (Cp), Eutrema salsugineum (Es), and T. hassleriana (Th). Numbers indicate bootstrap values of 10,000 iterations. Arabidopsis thaliana co-10 null mutant was complemented with cDNA of COL1, COL2, AeCO, AeCOL2, and ThCOL fused to 3xHA-tag expressed from pSUC2 (C) or pCO (D). Flowering time (mean total leaf number ± SD) was examined in independent homozygous transgenic lines (T3) in LD conditions. Col-0, co-10, and homozygous pCO::3xHA:CO, pAeCO::3xHA:CO (from fig. 1C) and pSUC2::3xHA:CO lines are shown as controls. Asterisks indicate statistically significant differences in leaf number (*P < 0.05; **P < 0.001) compared with Col-0 (wt).

