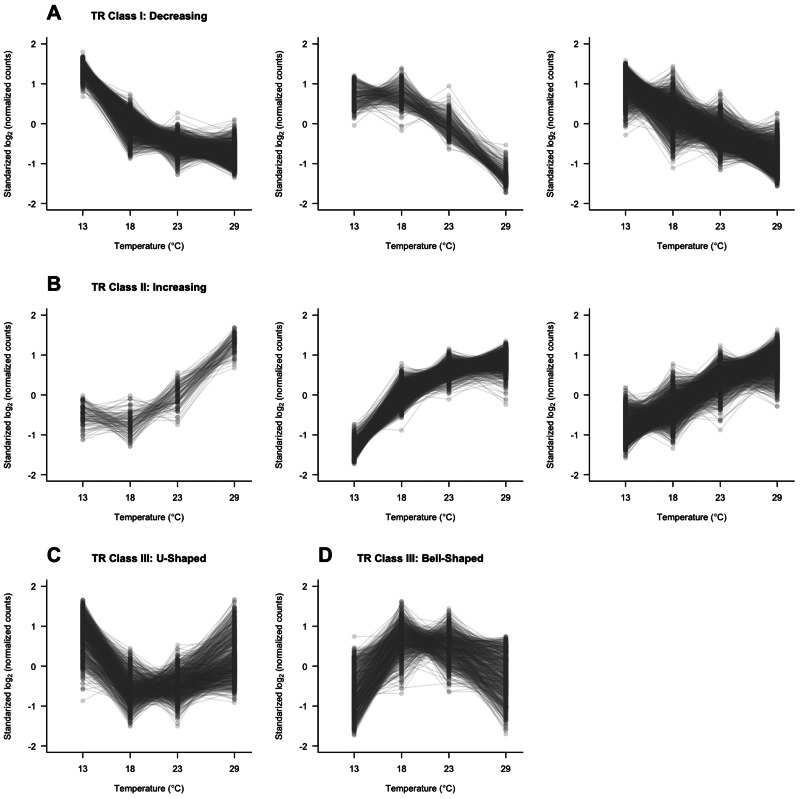
Fig. 1.
Classification of genes based on the expression plasticity. Read counts were normalized and then standardized to have a mean value equal to zero and variance equal to 1 (for illustration only). Median values for all three replicates in each temperature are presented as solid dots for each gene. (A) Class I: Genes with expression levels decreasing with temperature. (B) Class II: Genes with expression levels increasing with temperature. For (A) and (B), panels from left to right present the genes fitted in positive quadratic, negative quadratic, and linear model, respectively. (C, D) Class III/IV: Genes with min/max expression levels at the temperature between 18 and 23 °C.

