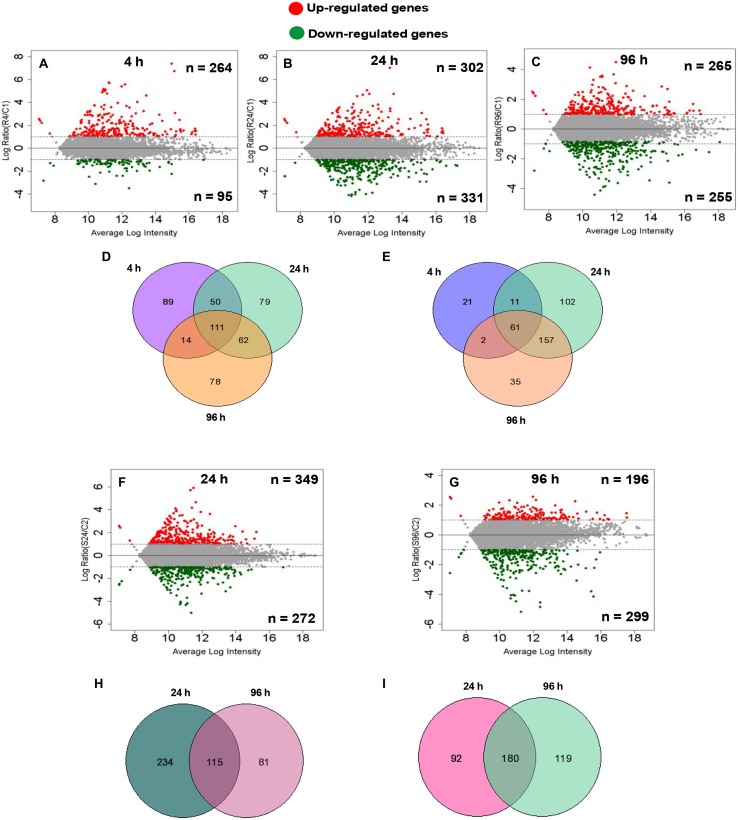
FIGURE 1.
Differentially expressed (DE) genes of root (n = 3) and shoot (n = 2) dataset at different time points compared with the control root and shoot samples calculated by difference (A–C,F,G) in arsenic-exposed Brassica juncea seedlings. Scatter plot represents average intensity (x-axis) vs. log2 ratio (y-axis). Red and green colors define the up-regulated and down-regulated genes at each time point. Venn analysis of common and exclusively differential (up-regulated and down-regulated) genes in arsenic-exposed B. Juncea root (n = 3) (D,E) and shoot (n = 2) (H,I) samples.

